
Debugging techniques
There are various techniques provided by UiPath Studio for debugging in order to check whether the workflow is running successfully or to find out errors in order to rectify them. At the top of the UiPath window, we can see various available methods of debugging inside the EXECUTE block, as shown in the following screenshot:
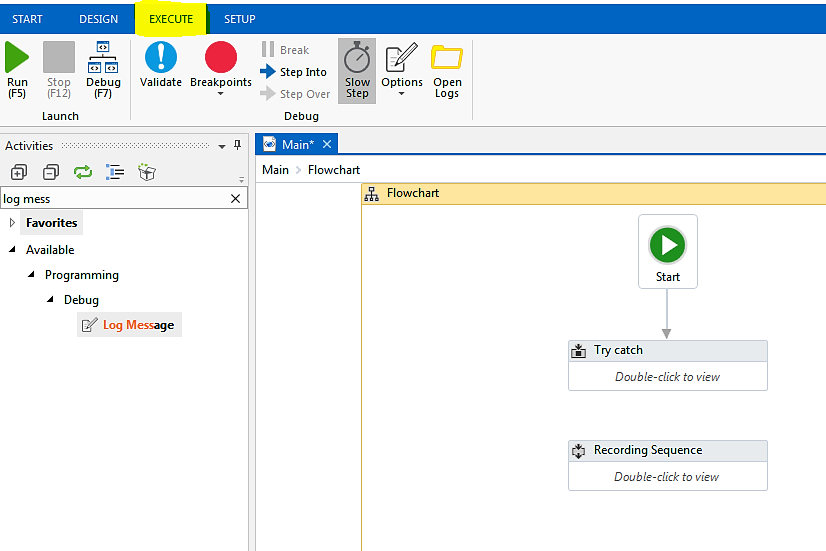
As shown in the preceding screenshot, there are various techniques for debugging. They are:
- Setting breakpoints
- Slow step
- Highlighting
- Break
Setting breakpoints
While debugging a workflow, we can set breakpoints in between if we want to run the program up to a specific location. This is useful when we have to stop before an activity ends completely. In such a case, we should use a breakpoint on the previous activity, as shown in the following screenshot:
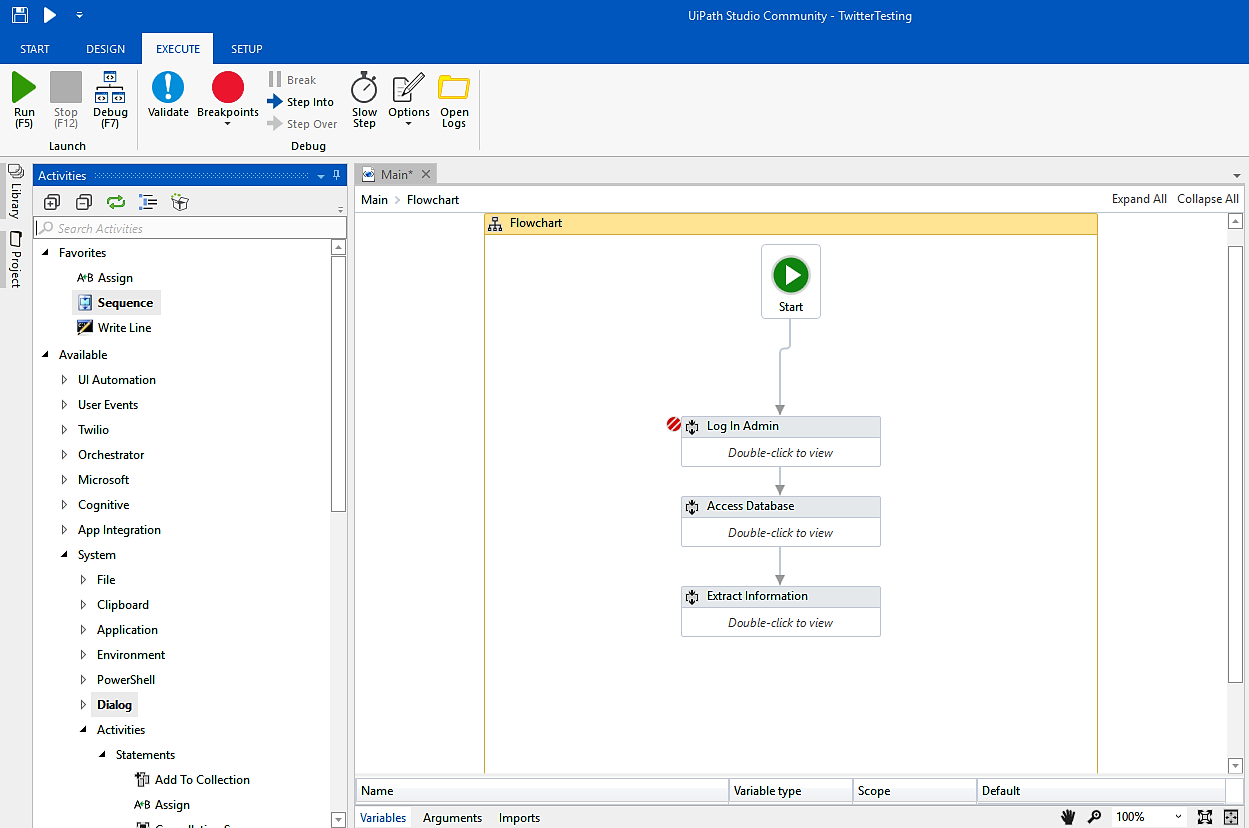
The highlighted region indicates the breakpoint since the execution stops just after the breakpoint. In order to continue any further, we have to click on the Continue button on the top corner indicated...