
Data visualization in Julia
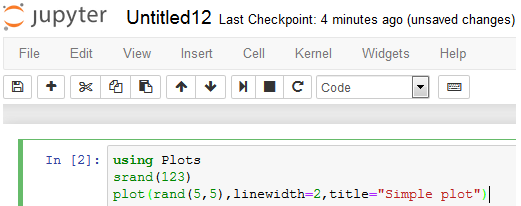
For the following Julia program, we use a package called Plots. The command used to install the package is Pkg.add("Plots"). Here, we run Julia programs via a Jupyter notebook. The Julia program is presented in the following screenshot:
After clicking Kernel on the menu bar, and then Restart and Run All, we get the following:
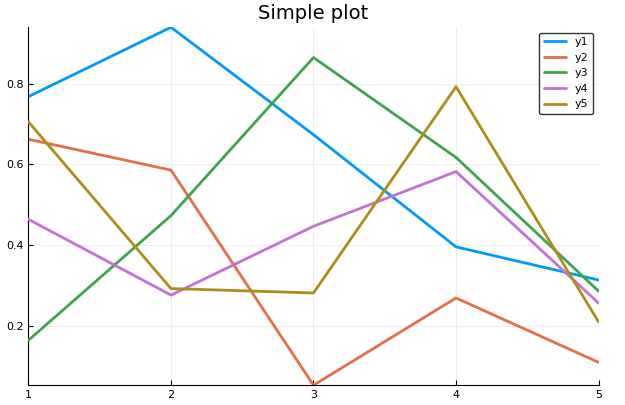
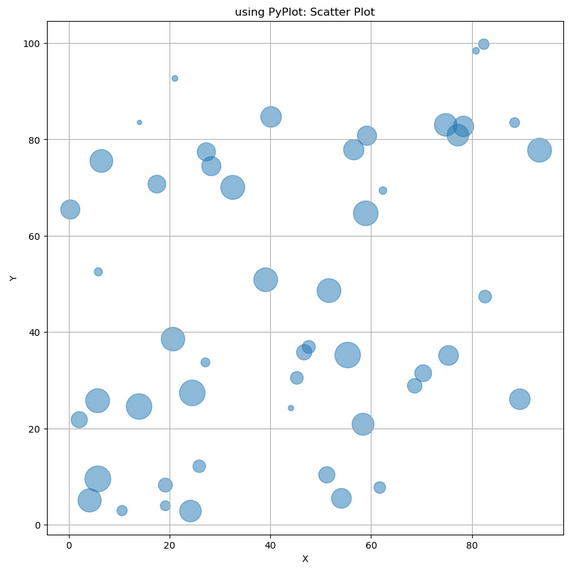
Again, the srand(123) command guarantees that any user who applies the same random seed will get the same set of random numbers. Because of this, he/she would get the same graph shown previously. The next example is a scatter plot using a Julia package called PyPlot:
using PyPlot
n=50
srand(333)
x = 100*rand(n)
y = 100*rand(n)
areas = 800*rand(n)
fig = figure("pyplot_scatterplot",figsize=(10,10))
ax = axes()
scatter(x,y,s=areas,alpha=0.5)
title("using PyPlot: Scatter Plot")
xlabel("X")
ylabel("Y")
grid("on")
The related graph is shown here:
The next Julia program is borrowed from Sargent and Stachurski (2017):
using QuantEcon: meshgrid...