Introduction to R packages – rattle
Before discussing one or two examples of using rattle, it might be a good idea to discuss an R package called rattle.data. As its name suggests, we could guess that it contains data used by rattle. It is a good idea to use a small dataset to generate a dendrogram. For the next case, we use the first 20 observations from a dataset called wine:
library(rattle.data)
data(wine)
x<-head(wine,20)
To launch rattle, we have the following two lines:
library(rattle)
rattle()
For data, we choose R Dataset, then choose x, as shown in the following screenshot. To save space, only the top part is presented here:
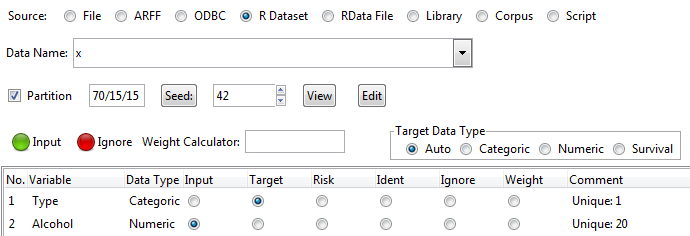
The following screenshot shows our choice:
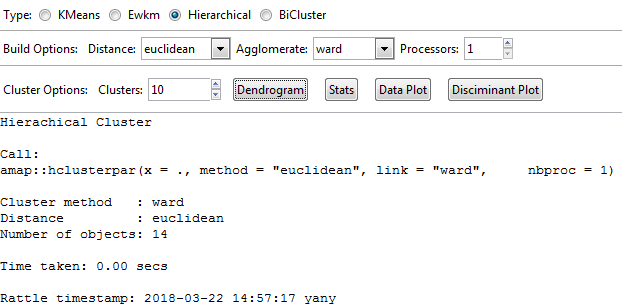
From the previous screenshot, we see 14 observations. Click Clusters, with a default of 10 clusters, and Dendrogram. See the result in the following screenshot:
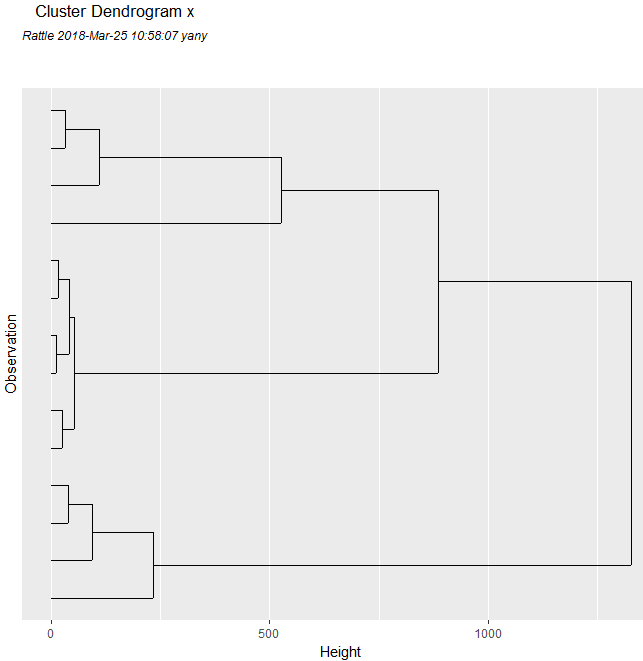
The previous dendrogram is a tree diagram that is used to show the relationship for a clustering analysis. Based on the definition of distance or relationship...