The Cacti web interface explained
The first time you log in, use the username admin and password admin (for Linux). You will be forced to change the admin password, but after doing so you will be presented with the Cacti web interface:
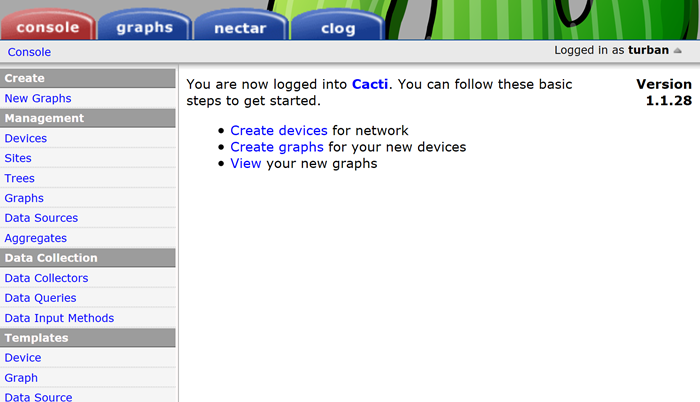
The initial page is called the Console and only administrators and users with special access rights are able to see it. From here you can fully administer Cacti.
The Console tab
The Console tab is where you manage your Cacti installation. From here you can add devices and users or create graphs and assign them to a tree. We're going to explain each of the menu sections here:
Create section
The Create section provides an easy access for new graph creations for specific devices. It's a shortcut to the create graphs link within each device.
Management section
The Management section, as its name says, allows the management of graphs, devices, data sources, graph trees, and the new Sites items as well as aggregate graphs. Sites is a new feature of Cacti and allows you to assign devices to a site. As with the old Cacti versions, within this section you can still add/edit or delete devices, delete graphs, add devices to trees, and much more.
Data Collection section
The Data Collection section describes the different ways that Cacti retrieves data from devices or systems. Here you can manage data queries such as SNMP retrieve methods, or manage the different input methods, which are used by external scripts called from the poller. With version 1.x, the new Data Collectors item has been added. Cacti 1.x allows you to have multiple remote pollers, and in this section you can add and manage these pollers. More to come in a later chapter.
Templates section
The Templates section provides an easy way of combining data templates into a graph (graph templates), graphs and data queries for a specific type of host (host templates), or different data source items (data templates). Many graph, data, and host templates are available on the Cacti forums.
Automation section
The Automation section is new in Cacti 1.x. It allows you to plan for automated network discovery as well as define rules for the automation of device and graph creation for auto-discovered devices. This section is based on the Discovery and Autom8 plugin which was already available for the 0.8.8 version of Cacti and has now been integrated into the main Cacti distribution.
Presets section
The Presets section allows you to configure the new VDEF rules as well as the old CDEF and GPRINT settings. The Data Profiles item is a new concept in Cacti 1.x. It defines the poller interval being used for the different data templates. This is where you will start the creation of a new one minute-based polling interval.
Import/Export section
The Import/Export section allows the import and export of templates. This is especially useful for providing templates of exotic devices to the Cacti community, or to import them from one of the many provided on the Cacti forum.
Cacti doesn't yet provide a method for importing or exporting other data (for example, device lists) from within the web interface.
Configuration section
Within the Configurationsection we can change the settings of Cacti. These settings include:
- General settings (for example, logging levels)
- Path settings (similar to the paths page from the installer)
- Device default settings (SNMP version, timeouts)
- Poller settings (number of threads, poller type to use)
- Data storage settings (set remote or local RRD file storage)
- Visual settings (size of the graphs, font size to use, theme to use)
- Authentication settings (local authentication, LDAP or HTTP basic, password settings)
- Data source statistics settings (enable/disable data source statistics collection)
- Performance settings (enable/disable on-demand RRD file updates and image caching)
- Spikes settings (enable/disable automated spike data removal)
- Mail/reporting/DNS settings (set email options, configure nectar/reporting and DNS settings)
Utilities section
The Utilitiessection provides access to some basic system tools such as log or poller cache management, and hosts the user management interface.
The graphs tab
The graphs tab is the main screen for end users. Here they can view the graphs for their devices and systems, and also change some personal settings:
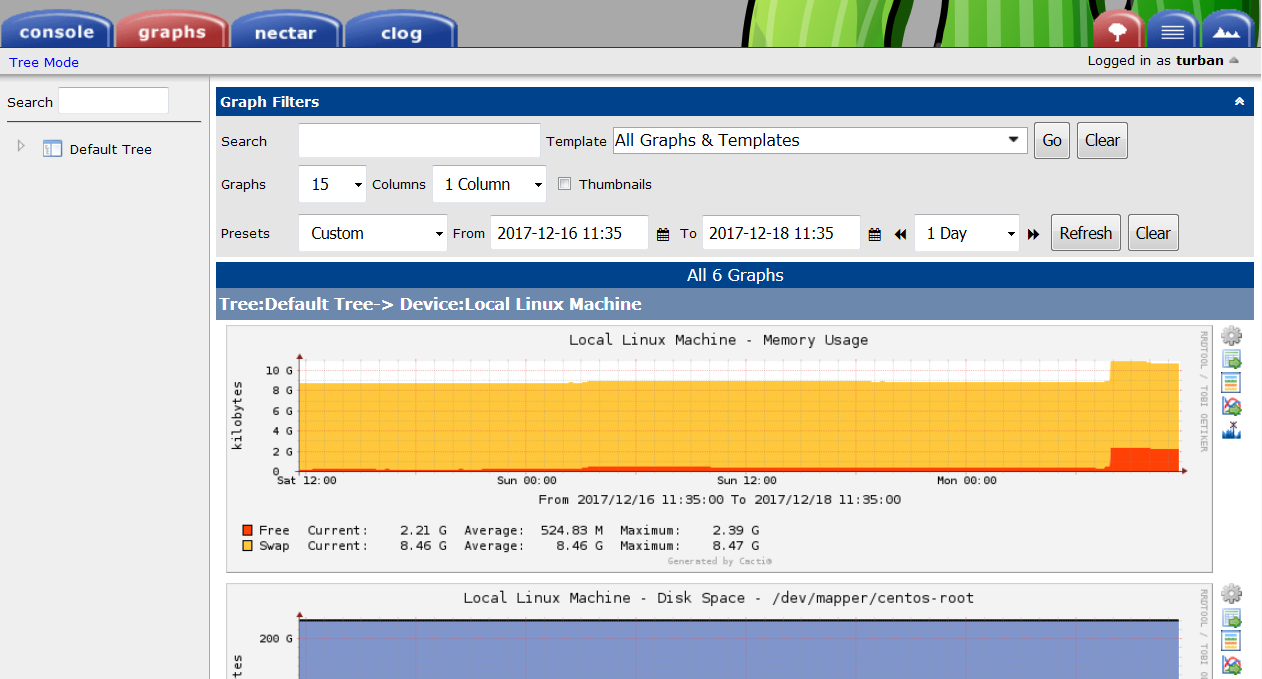
The graph tab contains a hierarchical tree to the left containing all devices a user is allowed to view. The main part of the page contains the graphs, and a filtering system for customizing the timeframe and graphs displayed based on a number of methods.
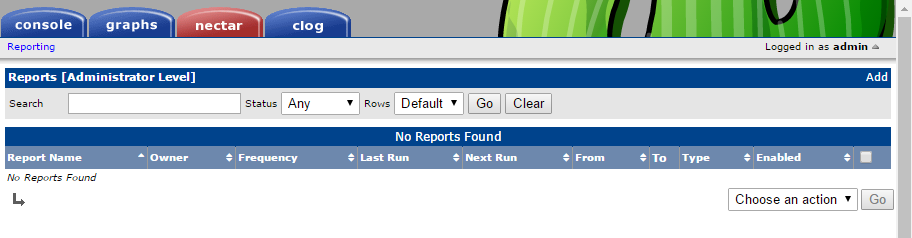
The nectar tab
The nectar tab provides you with some basic reporting functionality for Cacti. It is based on the Nectar plugin and has been integrated into Cacti 1.x:
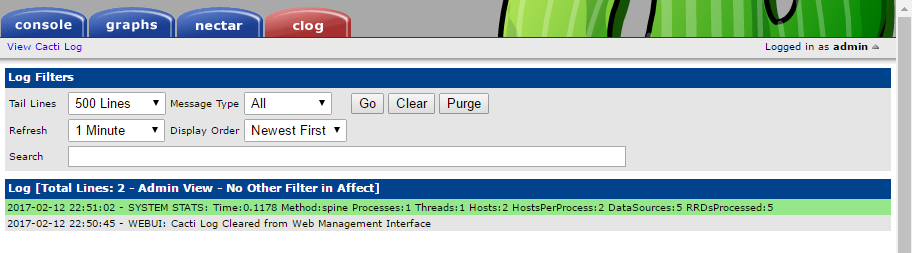
The clog tab
The clog tab provides the common log viewer for Cacti. From here you can view the Cacti log entries currently logging with basic reporting functionality. It is based on the Nectar plugin and has been integrated into Cacti 1.x: