Analyzing variables individually
First, let's define the names of the variables that we are going to use in this analysis. We have a list of the numerical variables and a list of the categorical variables. Then, we will redefine our housing DataFrame with a DataFrame that contains only the variables that we just defined. Then, we use the shape attribute to see the size of the new DataFrame:
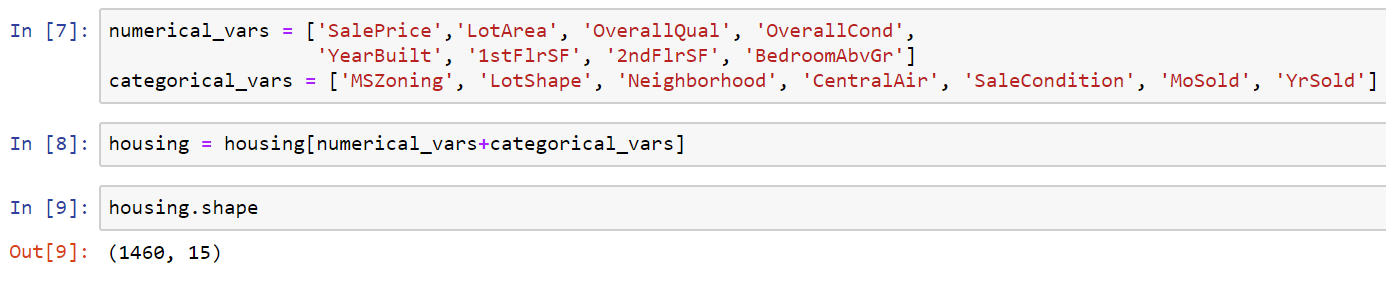
In the preceding diagram, we can see that the shape of our DataFrame has now changed because we have only 15 columns.
Understanding the main variable
Let's talk about the main variable that we want to understand, the SalePrice of the house. The first thing that we do when we have a categorical variable is that we usually want to know their descriptive statistics:
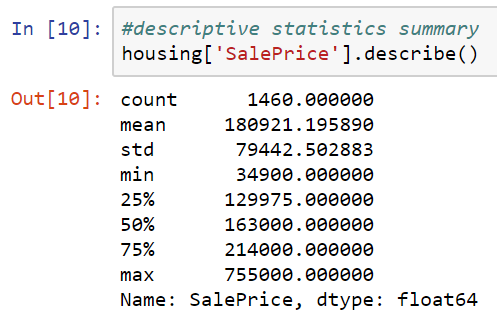
So here, we have an idea of the range of values for this variable. In the preceding diagram, we see that the mean price in the dataset is $180,000 for the average house. We have a standard deviation of around $80,000. The minimum value that corresponds...