Exploring CloudWatch metrics
In this section, we shall display the metrics:
- Click on
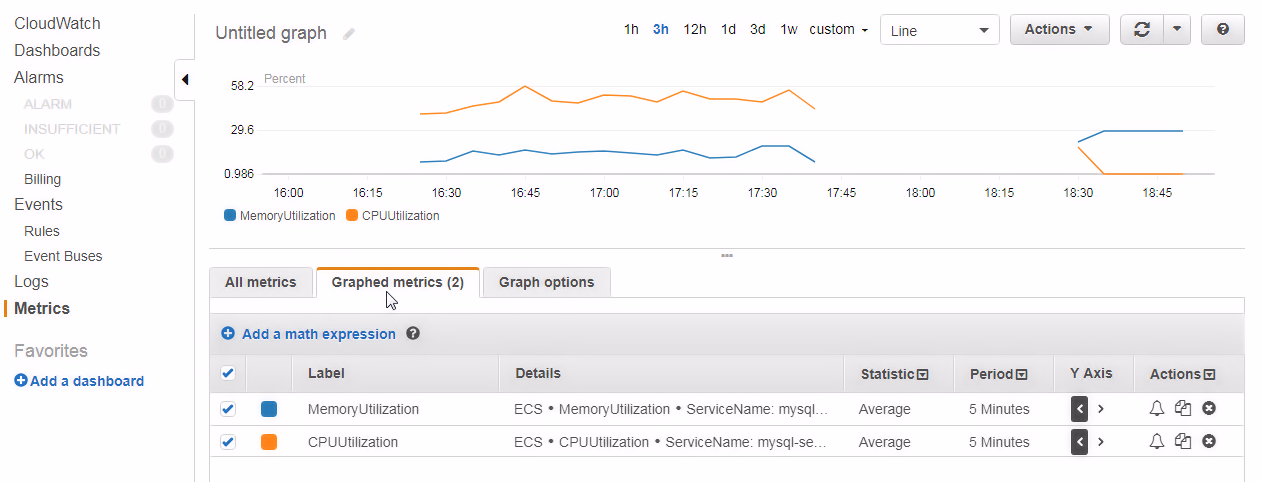
Metricsin the navigation, as shown in the following screenshot. Filter metrics for themysqlservice withAll|ECS ClusterName|ServiceNameSelectto display all metrics, which includeMemoryUtilizationandCPUUtilizationmetrics:
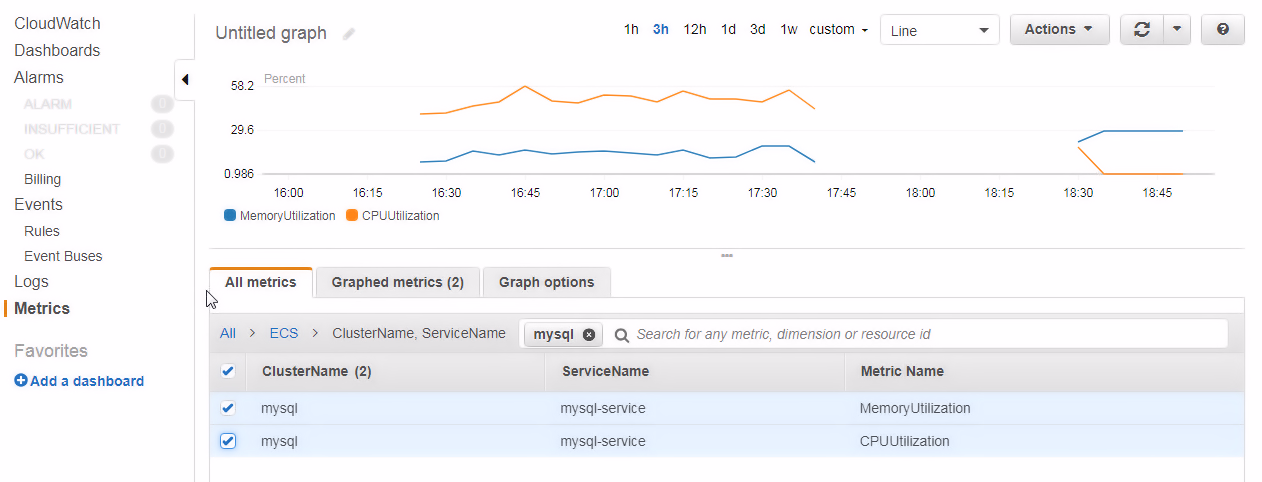
- Not all metrics may be graphed, although the
MemoryUtilizationandCPUUtilizationmetrics generated by a task are graphed. Select theGraphed metricstab to display only the graphed metrics: