Detect - using the ATP portal
The first thing you will see when you login to the ATP portal is the Dashboard view:
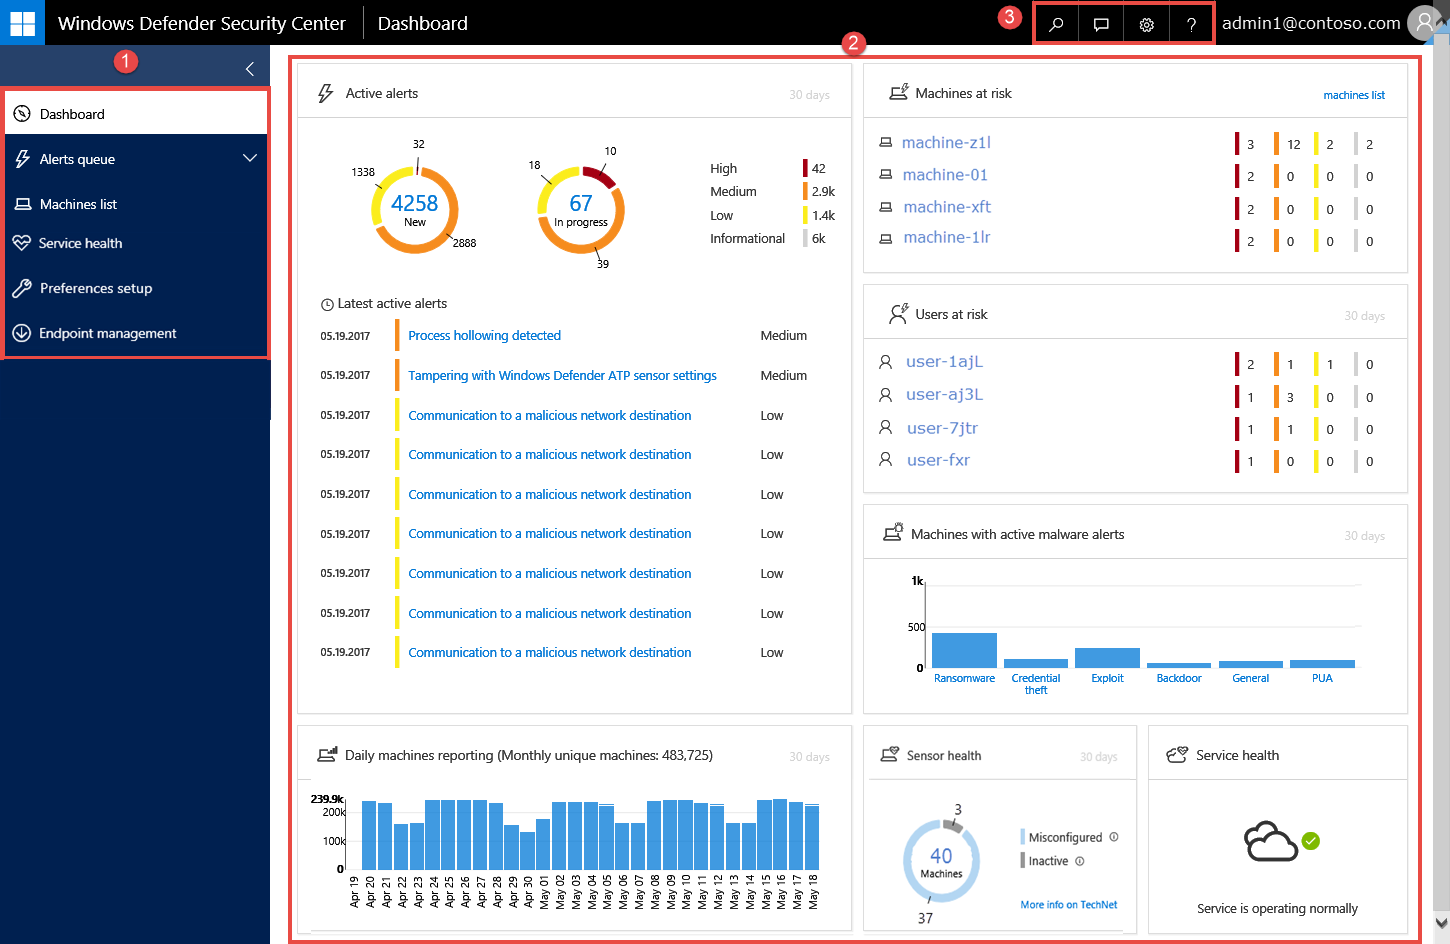
Dashboard navigation overview:
- Left-side navigation pane (
1) - Main portal window for displaying dashboard tiles and details (
2) - Search, Feedback, Settings, and Help and Support (
3)
The Dashboard displays a snapshot of the following components:
- The latest active alerts on your network, with the most important highlighted at the top
- Daily machines reporting to show how many machines are actively reporting each day
- Machines at risk will show those endpoints with the highest risks
- The users at risk report provides quick identification of those users
- Machines with active malware alerts
- Sensor and service health
Alerts queue
From the navigation pane, select Alerts queue. This view will show a list of alerts that were flagged from endpoints in your network. You can sort and filter the alerts by clicking on the column header. Select an alert to see further details, and change the status from New...