Search icon CANCEL
Subscription
0
Cart icon
Your Cart (0 item)
Close icon
You have no products in your basket yet
Save more on your purchases! discount-offer-chevron-icon
Savings automatically calculated. No voucher code required.
Arrow left icon
All Products
Best Sellers
New Releases
Books
Videos
Audiobooks
Learning Hub
Newsletter Hub
Free Learning
Arrow right icon
timer SALE ENDS IN
0 Days
:
00 Hours
:
00 Minutes
:
00 Seconds
Arrow up icon
GO TO TOP
Microsoft Power BI Cookbook

You're reading from   Microsoft Power BI Cookbook Creating Business Intelligence Solutions of Analytical Data Models, Reports, and Dashboards

Arrow left icon
Product type Paperback
Published in Sep 2017
Publisher Packt
ISBN-13 9781788290142
Length 802 pages
Edition 1st Edition
Languages
Arrow right icon
Author (1):
Arrow left icon
 Powell Powell
Author Profile Icon Powell
Powell
Arrow right icon
View More author details
Toc

Table of Contents (21) Chapters Close

Title Page
Credits
Foreword
About the Author
About the Reviewers
www.PacktPub.com
Customer Feedback
Preface
1. Configuring Power BI Development Tools FREE CHAPTER 2. Accessing and Retrieving Data 3. Building a Power BI Data Model 4. Authoring Power BI Reports 5. Creating Power BI Dashboards 6. Getting Serious with Date Intelligence 7. Parameterizing Power BI Solutions 8. Implementing Dynamic User-Based Visibility in Power BI 9. Applying Advanced Analytics and Custom Visuals 10. Developing Solutions for System Monitoring and Administration 11. Enhancing and Optimizing Existing Power BI Solutions 12. Deploying and Distributing Power BI Content 13. Integrating Power BI with Other Applications

Visualizing the M library


To implement complex and less common data requirements, it's often necessary to browse the M library to find a specific function or review the parameters of a specific function. This short recipe provides a pre-built M query expression you can use to retrieve the M library into a table for analysis in Power BI Desktop. Additionally, an example is provided of visualizing and cross-filtering this table of functions on the Power BI report canvas.

How to do it...

  1. Open a new Power BI Desktop file (PBIX) and create a blank Query.
  2. Enter the following M code in the Advanced Editor:

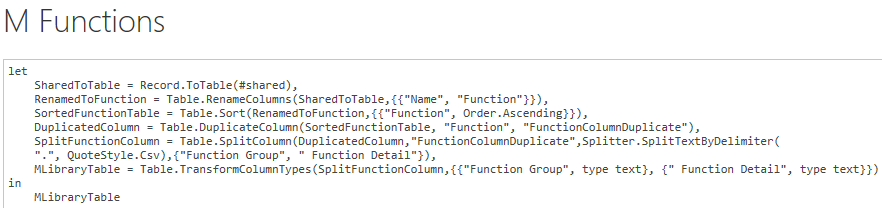
Figure 157: M Expression to Retrieve a Table of the M Library

  • The Query Editor should look like the screenshot:

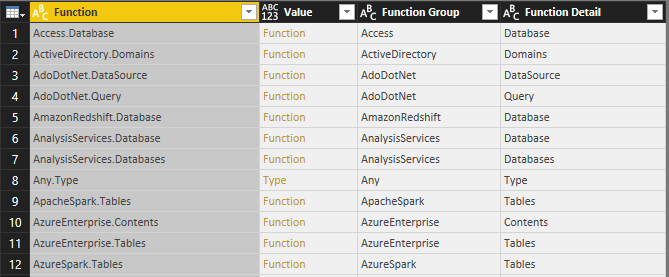
Figure 158: Query Editor View of Library Table Function

  1. Click on Close and Apply from the Query Editor.
  2. The 785+ rows from the M library are now loaded to the data model.
  3. Create a Report Page Visual that uses the Function Group column for filtering.

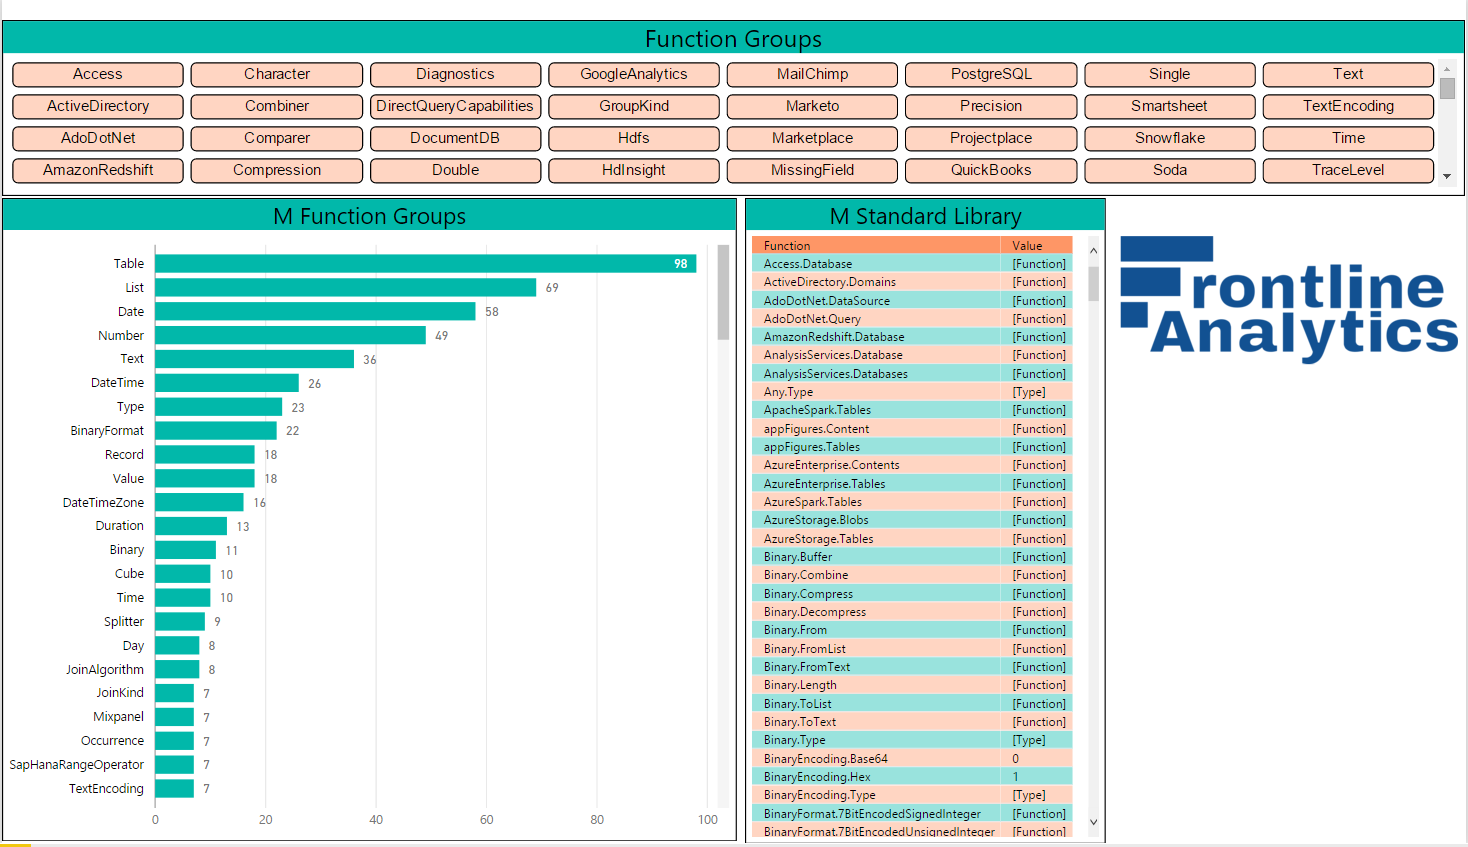
Figure 159: Report Page of M Standard...

lock icon The rest of the chapter is locked
Register for a free Packt account to unlock a world of extra content!
A free Packt account unlocks extra newsletters, articles, discounted offers, and much more. Start advancing your knowledge today.
Unlock this book and the full library FREE for 7 days
Get unlimited access to 7000+ expert-authored eBooks and videos courses covering every tech area you can think of
Renews at £13.99/month. Cancel anytime
Visually different images