Search icon CANCEL
Subscription
0
Cart icon
Your Cart (0 item)
Close icon
You have no products in your basket yet
Save more on your purchases! discount-offer-chevron-icon
Savings automatically calculated. No voucher code required.
Arrow left icon
All Products
Best Sellers
New Releases
Books
Videos
Audiobooks
Learning Hub
Newsletter Hub
Free Learning
Arrow right icon
timer SALE ENDS IN
0 Days
:
00 Hours
:
00 Minutes
:
00 Seconds
Arrow up icon
GO TO TOP
Hands-On Automated Machine Learning

You're reading from   Hands-On Automated Machine Learning A beginner's guide to building automated machine learning systems using AutoML and Python

Arrow left icon
Product type Paperback
Published in Apr 2018
Publisher Packt
ISBN-13 9781788629898
Length 282 pages
Edition 1st Edition
Languages
Arrow right icon
Authors (2):
Arrow left icon
 Das Das
Author Profile Icon Das
Das
 Mert Cakmak Mert Cakmak
Author Profile Icon Mert Cakmak
Mert Cakmak
Arrow right icon
View More author details
Toc

Table of Contents (15) Chapters Close

Title Page
Copyright and Credits
Packt Upsell
Contributors
Preface
1. Introduction to AutoML FREE CHAPTER 2. Introduction to Machine Learning Using Python 3. Data Preprocessing 4. Automated Algorithm Selection 5. Hyperparameter Optimization 6. Creating AutoML Pipelines 7. Dive into Deep Learning 8. Critical Aspects of ML and Data Science Projects 1. Other Books You May Enjoy Index

Important evaluation metrics – classification algorithms


Most of the metrics used to assess a classification model are based on the values that we get in the four quadrants of a confusion matrix. Let's begin this section by understanding what it is:

  • Confusion matrix: It is the cornerstone of evaluating a classification model (that is, classifier). As the name stands, the matrix is sometimes confusing. Let's try to visualize the confusion matrix as two axes in a graph. The xaxis label is prediction, with two values—Positive and Negative. Similarly, theyaxis label is actually with the same two values—PositiveandNegative, as shown in the following figure. This matrix is a table that contains the information about the count of actual and predicted values by a classifier:

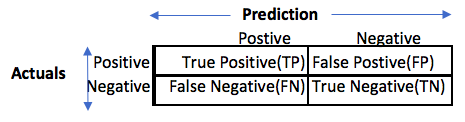
  • If we try to deduce information about each quadrant in the matrix:
    • Quadrant one is the number of positive class predictions that were accurately identified. So, it is termed as True Positive (TP).
    • Quadrant two, also known as False...
lock icon The rest of the chapter is locked
Register for a free Packt account to unlock a world of extra content!
A free Packt account unlocks extra newsletters, articles, discounted offers, and much more. Start advancing your knowledge today.
Unlock this book and the full library FREE for 7 days
Get unlimited access to 7000+ expert-authored eBooks and videos courses covering every tech area you can think of
Renews at £13.99/month. Cancel anytime
Visually different images