Search icon CANCEL
Subscription
0
Cart icon
Your Cart (0 item)
Close icon
You have no products in your basket yet
Save more on your purchases! discount-offer-chevron-icon
Savings automatically calculated. No voucher code required.
Arrow left icon
All Products
Best Sellers
New Releases
Books
Videos
Audiobooks
Learning Hub
Newsletter Hub
Free Learning
Arrow right icon
timer SALE ENDS IN
0 Days
:
00 Hours
:
00 Minutes
:
00 Seconds
Arrow up icon
GO TO TOP
Zabbix Cookbook

You're reading from   Zabbix Cookbook Over 70 hands-on recipes to get your infrastructure up and running with Zabbix

Arrow left icon
Product type Paperback
Published in Mar 2015
Publisher
ISBN-13 9781784397586
Length 260 pages
Edition 1st Edition
Tools
Concepts
Arrow right icon
Author (1):
Arrow left icon
Patrik Uytterhoeven Patrik Uytterhoeven
Author Profile Icon Patrik Uytterhoeven
Patrik Uytterhoeven
Arrow right icon
View More author details
Toc

Table of Contents (18) Chapters Close

Zabbix Cookbook
Credits
About the Author
About the Reviewers
www.PacktPub.com
Preface
1. Zabbix Configuration FREE CHAPTER 2. Getting Around in Zabbix 3. Groups, Users, and Permissions 4. Monitoring with Zabbix 5. Testing with Triggers in Zabbix 6. Working with Templates 7. Data Visualization and Reporting in Zabbix 8. Monitoring VMware and Proxies 9. Autodiscovery 10. Zabbix Maintenance and API Upgrading and Troubleshooting Zabbix Index

Monitoring Zabbix


When you run Zabbix, it's not always easy to know how many pollers you need, for example for SNMP, IPMI, and so on. To find out more about this, Zabbix has some built-in health checks. In this topic, we will show you how to read them.

Getting ready

For this recipe, make sure that you are a Zabbix administrator and that you have your agent configured on the Zabbix server. Also make sure that the template Template App Zabbix Server is linked with your Zabbix host.

How to do it

From the menu, go to Monitoring | Latest data and select the Zabbix server as host to see. Select Zabbix server from the item list to get an overview of the data of all items:

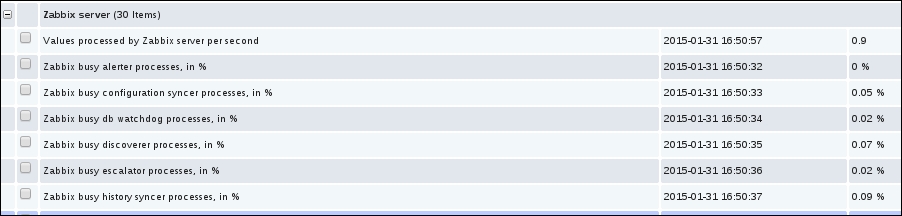
Here we have an easy overview of how much our pollers are busy or idle. Remember that in our Zabbix 2.4, we have graphs automatically generated in Latest data, so we can click on those graphs and see easy if, for example, at a certain time pollers were not enough available.

The data that we see here is based on the internal items, more...

lock icon The rest of the chapter is locked
Register for a free Packt account to unlock a world of extra content!
A free Packt account unlocks extra newsletters, articles, discounted offers, and much more. Start advancing your knowledge today.
Unlock this book and the full library FREE for 7 days
Get unlimited access to 7000+ expert-authored eBooks and videos courses covering every tech area you can think of
Renews at $15.99/month. Cancel anytime
Visually different images