Monitoring
Elasticsearch exposes several APIs to monitor cluster health. In this section, we will discuss the native APIs and also X-Pack monitoring, which is available via Kibana. Kibana provides a nice UI and, more importantly, historical data to compare the metrics. You can open Kibana by going to the following URL:
http://localhost:5601/
The default username and password for Kibana are elastic and changeme. You should a screen similar to this:
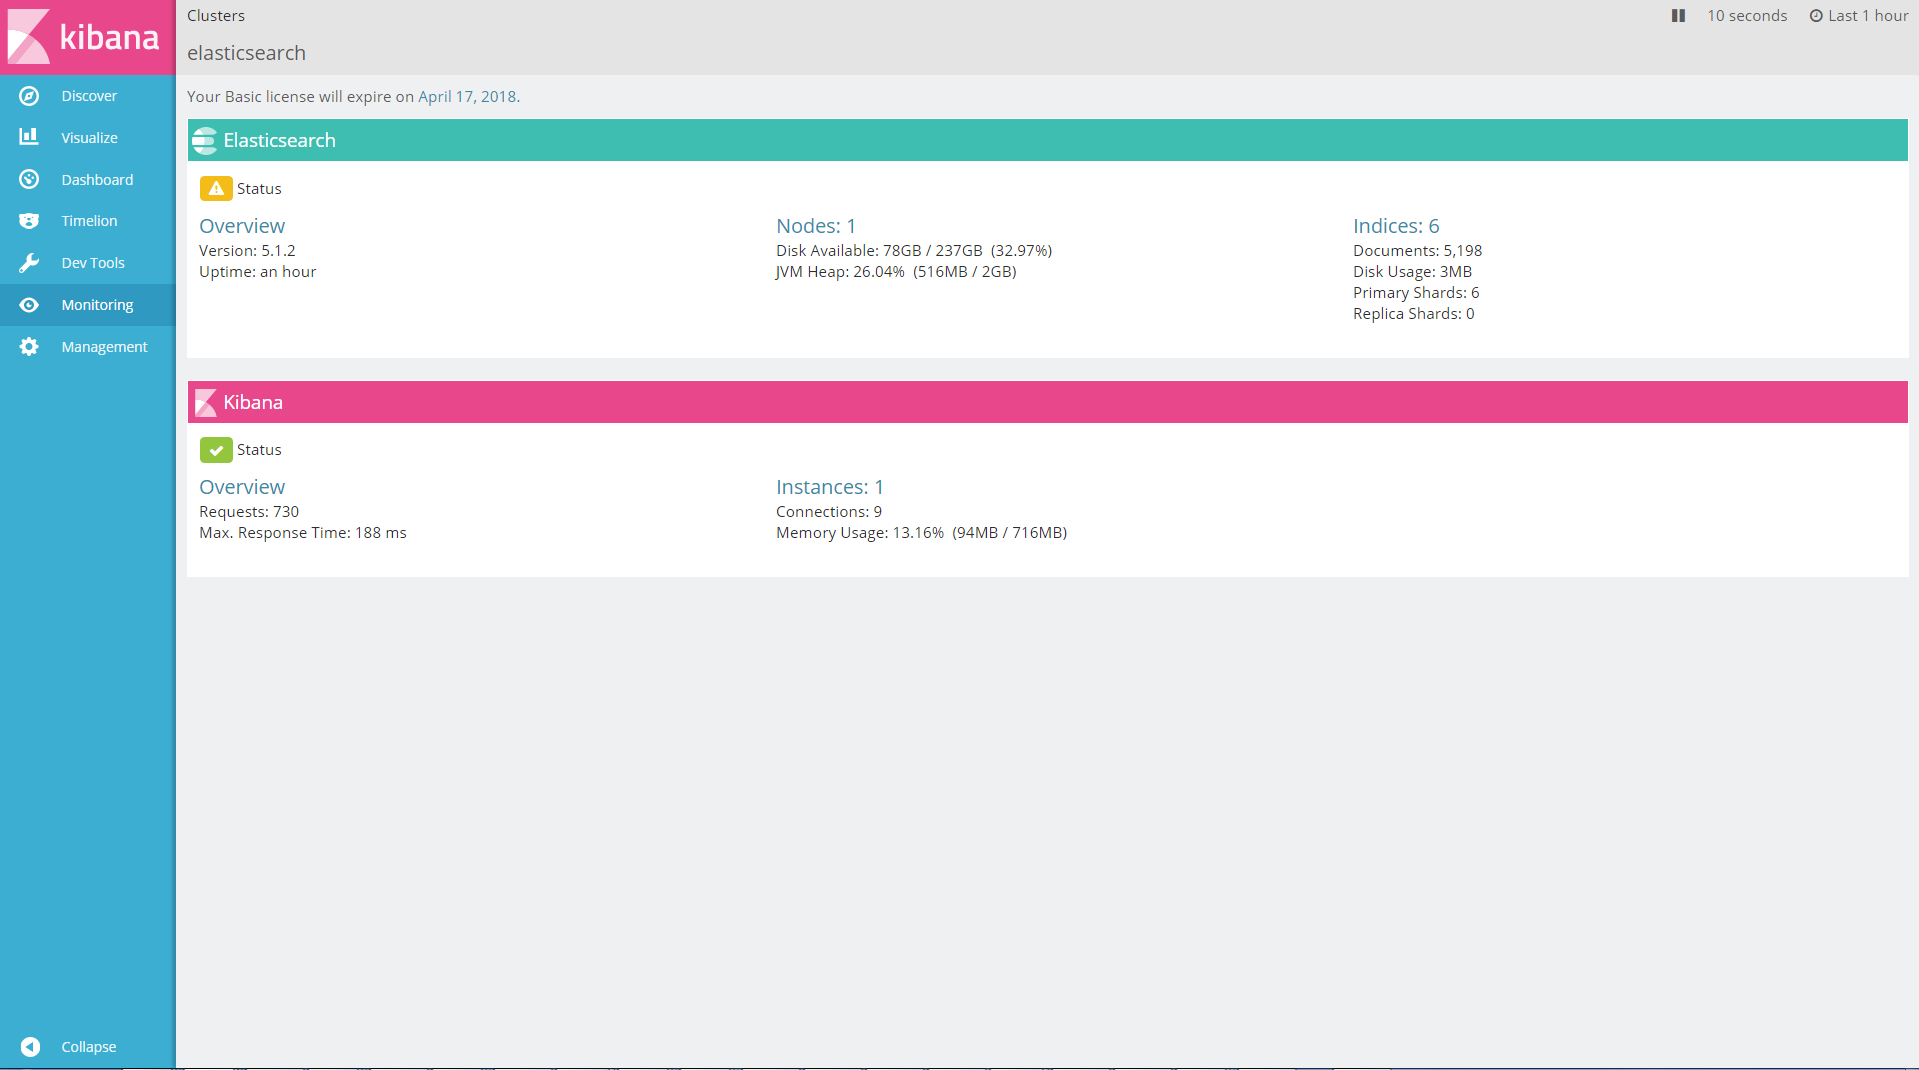
You can see that monitoring is available for both Elasticsearch and Kibana. If you have Logstash installed, you can also monitor Logstash.
Monitoring Elasticsearch clusters
You can use _cluster API to retrieve the cluster stats:
GET /_cluster/stats/?human&pretty
Refer to the Configuration Elasticsearch section to understand the important sections in the stats response. You can also monitor cluster-level metric, such as index rate/search rate from the Monitoring page as shown here:
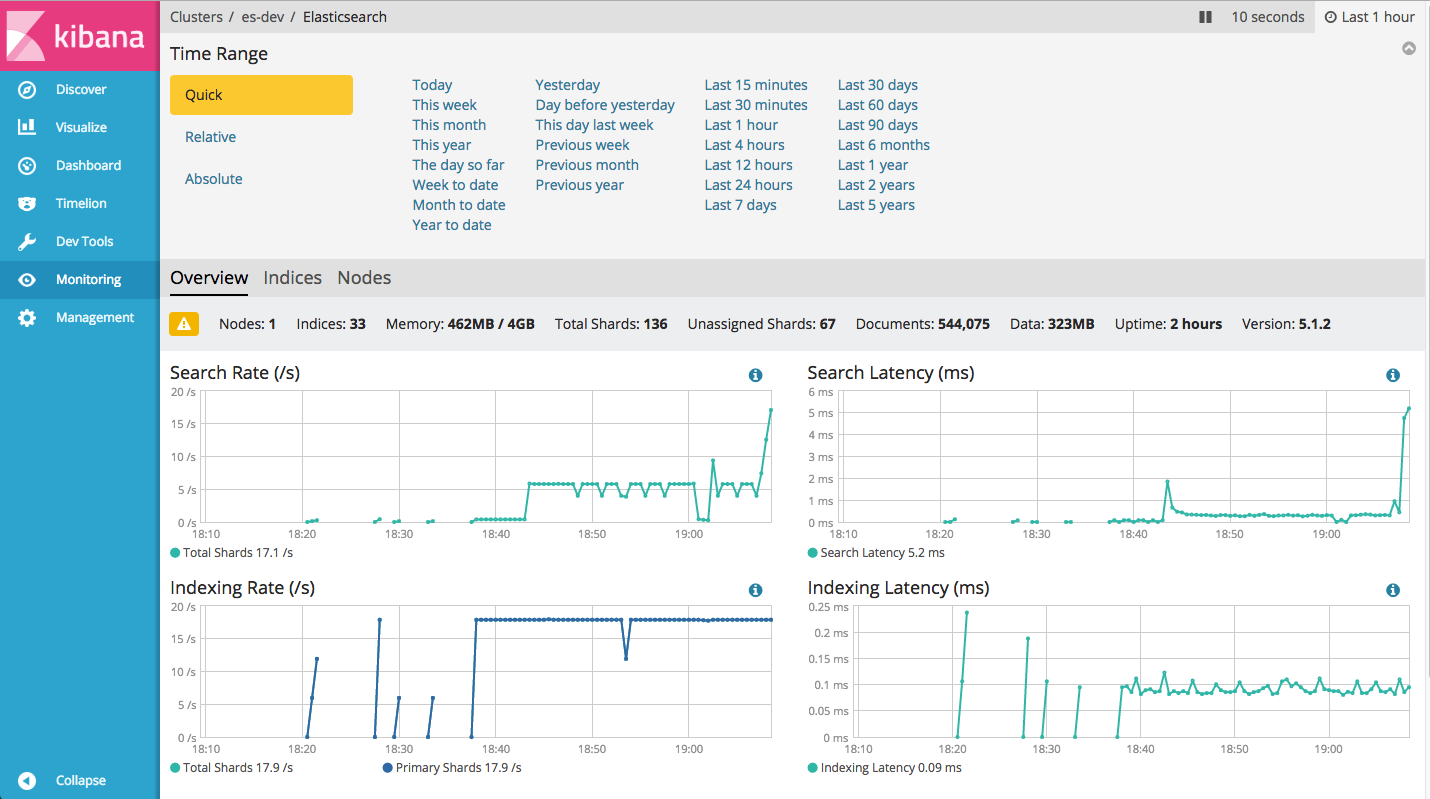
At the top right corner, click on the clock icon to choose the time...