
The normal distribution
The normal distribution is a theoretical distribution that idealizes many distributions like the one in Figure 3-20. It is also called the bell shape curve or the Gaussian distribution, after its discoverer, Carl Friedrich Gauss (1777-1855).
The shape of the normal distribution is the graph of the following function:
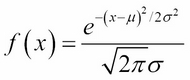
Here, m is the mean and s is the standard deviation. The symbols e and  are a mathematical constant: e = 2.7182818 and = 3.14159265. This function is called the density function for the (theoretical) distribution.
Note the distinction between the four symbols  , s, m, and s. The first two are computed from the actual sample values; the second two are parameters used to define a theoretical distribution.
A thought experiment
To see how the normal distribution relates to actual statistics, imagine an experiment where you have a large flat clear jar that contains n (balanced) coins. When you shake the jar, some number x of those coins will settle heads up....