Standard deviation and variance
Let's talk about standard deviation and variance. The concepts and terms you've probably heard before, but let's go into a little bit more depth about what they really mean and how you compute them. It's a measure of the spread of a data distribution, and that will make a little bit more sense in a few minutes.
Standard deviation and variance are two fundamental quantities for a data distribution that you'll see over and over again in this book. So, let's see what they are, if you need a refresher.
Variance
Let's look at a histogram, because variance and standard deviation are all about the spread of the data, the shape of the distribution of a dataset. Take a look at the following histogram:
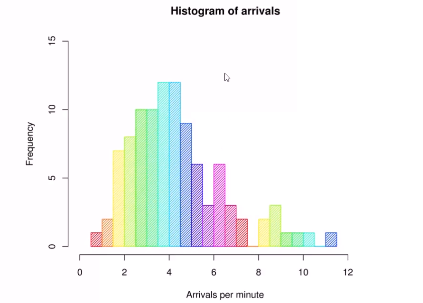
Let's say that we have some data on the arrival frequency of airplanes at an airport, for example, and this histogram indicates that we have around 4 arrivals per minute and that happened on around 12 days that we looked at for this data. However, we also have these outliers...