Visualizing a search tree
In the previous chapter, you learned that a graph is a structure in which nodes are connected by edges. A tree is a special type of graph, in which there are no cycles and two nodes are connected by one path. For visualizing trees, we'll use the pydot Python library, which is a Python interface to Graphviz's DOT language. In Chapter 1, Understanding the Depth-First Search Algorithm, we learned that Graphviz is open source graph visualization software, and it provides the DOT language for creating layered drawings of directed graphs. In addition, we'll be using the matplotlib library for displaying the final rendered image.
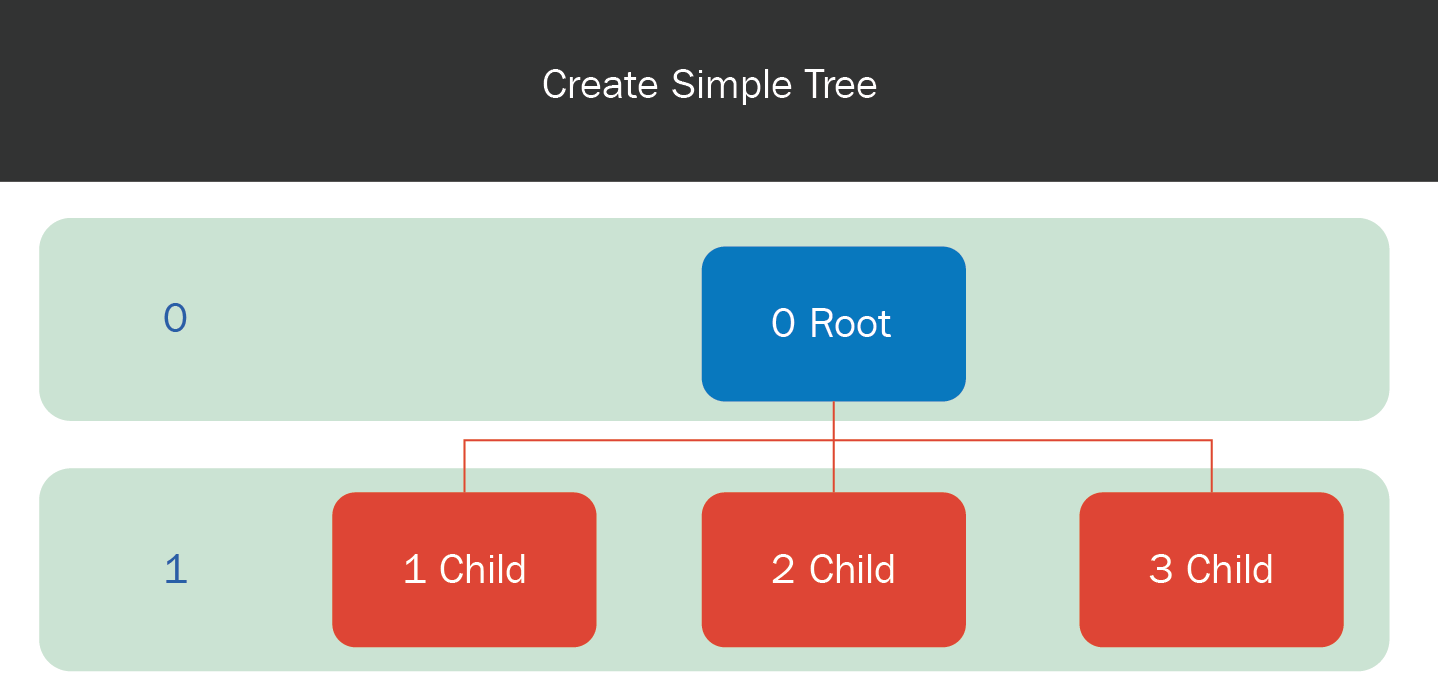
Now, let's use these libraries to visualize the following simple tree. It has a root node, and three children under the root node:

Figure 5
Consider the following code:
...
import pydot
import matplotlib.image as mpimg
import matplotlib.pyplot as plt

#create graph object
graph = pydot.Dot(graph_type='graph', dpi = 300)


#create and add root node...


