Debugging the build system
In the last recipe of this chapter, we will explore the different methods available to debug problems with the build system and its metadata.
Getting ready
Let's first introduce some of the usual use cases for a debugging session.
Finding recipes
A good way to check whether a specific package is supported in your current layers is to search for it as follows:
$ cd /opt/yocto/fsl-community-bsp/sources$ find -name "*busybox*"
This will recursively search all layers for the BusyBox pattern. You can limit the search to recipes and append files by executing:
$ find -name "*busybox*.bb*"Yocto includes a bitbake-layers command-line utility that can also be used to search for specific recipes on the configured layers, with the preferred version appearing first:
$ bitbake-layers show-recipes "<package_name>"Here, <package_name> also supports wildcards.
For example:
$ bitbake-layers show-recipes gdb*=== Matching recipes: ===gdb: meta 7.12.1gdb-cross-arm: meta 7.12.1gdb-cross-canadian-arm: meta 7.12.1gdbm: meta 1.12
Note
To use bitbake-layers, the environment script must have been sourced first.
Finally, the devtool command-line utility can also be used to search the dependency cache with a regular expression. It will search on recipe or package names but also description and install files, so it is better suited in the context of developing recipes metadata:
$ devtool search <regular expression>To use devtool, the environment needs to be previously set up, and the shared state cache populated:
$ cd /opt/yocto/fsl-community-bsp$ source setup-environment wandboard$ bitbake <target-image>$ devtool search gdbLoaded 2323 entries from dependency cache.perl Perl scripting languageshared-mime-info Shared MIME type database and specificationbash-completion Programmable Completion for Bash 4glib-2.0 A general-purpose utility librarypython The Python Programming Languagegdbm Key/value database library with extensible hashinggcc-runtime Runtime libraries from GCC
Dumping BitBake's environment
When developing or debugging package or image recipes, it is very common to ask BitBake to list its environment both globally and for a specific target, be it a package or image.
To dump the global environment and grep for a variable of interest (for example, DISTRO_FEATURES), use the following command:
$ bitbake -e | grep -w DISTRO_FEATURESOptionally, to locate the source directory for a specific package recipe such as BusyBox, use the following command:
$ bitbake -e busybox | grep ^S=You could also execute the following command to locate the working directory for a package or image recipe:
$ bitbake -e <target> | grep ^WORKDIR=Using the development shell
BitBake offers the devshell and devpyshell tasks to help developers. They are executed with the following commands:
$ bitbake -c devshell <target>And:
$ bitbake -c devpyshell <target>They will unpack and patch the source, and open a new Terminal (they will autodetect your Terminal type or it can be set with OE_TERMINAL) in the target source directory, which has the environment correctly set up. They run with the nostamp flag so up-to-date tasks will be rerun.
The devpyshell command will additionally set up the Python environment including Python objects and code such as the datastore d object.
Note
While in a graphical environment, devshell and devpyshell will open a new Terminal or console window, but if we are working on a non-graphical environment, such as Telnet or SSH, you may need to specify screen as your Terminal in your conf/local.conf configuration file as follows:OE_TERMINAL = "screen"
Inside the devshell, you can run development commands such as configure and make or invoke the cross-compiler directly (use the $CC environment variable, which has been set up already). You can also run BitBake tasks inside devshell by calling the ${WORKDIR}/temp/run* script directly. This has the same result as invoking BitBake externally to devshell for that task.
Inside the devpyshell Python interpreter, you can call functions, such as d.setVar() and d.getVar(), or any Python code, such as bb.build.exec_fun().
How to do it...
The starting point for debugging a package build error is the BitBake error message printed on the build process. This will usually point us to the task that failed to build.
- To list all the tasks available for a given recipe, with descriptions, we execute the following:
$ bitbake -c listtasks <target>- If you need to recreate the error, you can force a build with the following:
$ bitbake -f <target>- Or you can ask BitBake to force-run only a specific task using the following command:
$ bitbake -c compile -f <target>Note
Forcing a task to run will taint the task and BitBake will show a warning. This is meant to inform that the build has been modified. You can remove the warnings by cleaning the work directory with the -c clean argument.
Task log and run files
To debug the build errors, BitBake creates two types of useful files per shell task and stores them in a temp folder in the working directory. Taking BusyBox as an example, we would look into:
/opt/yocto/fsl-community-bsp/wandboard/tmp/work/cortexa9hf-neon-poky-linux-gnueabi/busybox/1.24.1-r0/tempAnd find a list of log* and run* files. The filename format is:
log.do_<task>.<pid> and run.do_<task>.<pid>.But luckily, we also have symbolic links without the <pid> part that link to the latest version.
The log files will contain the output of the task, and that is usually the only information we need to debug the problem. The run file contains the actual code executed by BitBake to generate the log mentioned before. This is only needed when debugging complex build issues.
Python tasks, on the other hand, do not currently write files as described previously, although it is planned to do so in the future. Python tasks execute internally and log information to the Terminal.
Note
If using the rm_work class, the package name needs to be added to the RM_WORK_EXCLUDE variable for the task log and run files to be accessible.
Adding logging to recipes
BitBake recipes accept either Bash or Python code. Python logging is done through the bb class and uses the standard logging Python library module. It has the following components:
bb.plain: This useslogger.plain. It can be used for debugging, but should not be committed to the source.bb.note: This useslogger.info.bb.warn: This useslogger.warn.bb.error: This useslogger.error.bb.fatal: This useslogger.criticaland exits BitBake.bb.debug: This should be passed a log level as the first argument and useslogger.debug.
To print debug output from Bash in our recipes, we need to use the logging class by executing:
inherit logging
The logging class is inherited by default by all recipes containing base.bbclass, so we don't usually have to inherit it explicitly. We will then have access to the following Bash functions:
bbplain: This function outputs literally what's passed in. It can be used in debugging but should not be committed to a recipe source.bbnote: This function prints with theNOTEprefix.bbwarn: This prints a non-fatal warning with theWARNINGprefix.bberror: This prints a non-fatal error with theERRORprefix.bbfatal: This function halts the build and prints an error message as withbberror.bbdebug: This function prints debug messages with the log level passed as the first argument. It is used with the following format:
bbdebug [123] "message"Note
The Bash functions mentioned here do not log to the console but only to the log files.
Looking at dependencies
You can ask BitBake to print the current and provided versions of packages with the following command:
$ bitbake --show-versionsAnother common debugging task is the removal of unwanted dependencies.
To see an overview of pulled-in dependencies, you can use BitBake's verbose output by running this:
$ bitbake -v <target>To analyze what dependencies are pulled in by a package, we can ask BitBake to create DOT files that describe these dependencies by running the following command:
$ bitbake -g <target>The DOT format is a text description language for graphics that is understood by the GraphViz open source package and all the utilities that use it. DOT files can be visualized or further processed.
You can omit dependencies from the graph to produce more readable output. For example, to omit dependencies from glibc, you would run the following command:
$ bitbake -g <target> -I glibcOnce the preceding commands have been run, we get the following files in the current directory:
pn-buildlist: This file shows the list of packages that would be built by the given targetrecipes-depends.dot: This file shows the dependencies between recipestask-depends.dot: This file shows the dependencies between tasks
To convert the .dot files to postscript files (.ps), you may execute:
$ dot -Tps filename.dot -o outfile.psHowever, the most useful way to display dependency data is to ask BitBake to display it graphically with the dependency explorer, as follows:
$ bitbake -g -u taskexp <target>The result may be seen in the following screenshot:
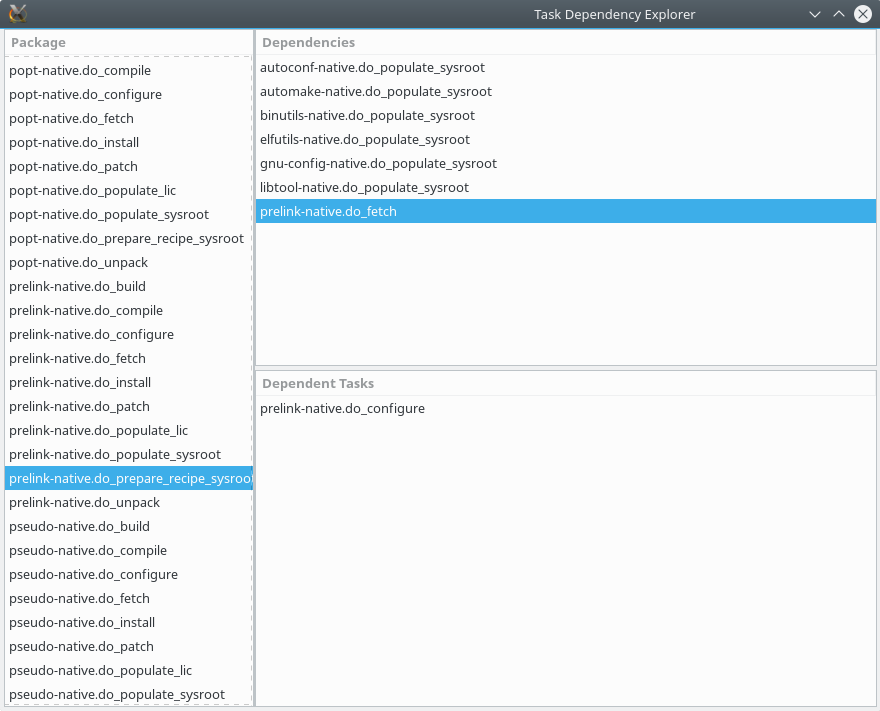
Task dependency explorer
Debugging dependencies
On rare occasions, you may find yourself debugging a task dependency problem, for example, if BitBake misses a task dependency.
In the tmp/stamps sub-directory inside the build directory, you can find two file types that are helpful when debugging dependency problems:
sigdata, a Python database of all the metadata that is used to calculate the task's input checksumsiginfo, which is the same but for shared state cache accelerated recipes
You can use bitbake-dumpsig on both of these file types to dump the variable dependencies for the task, variable values, as well as a list of variables never included in any checksum.
When trying to compare two versions of a given task, bitbake-diffsig can be used to dump the differences between two sigdata or siginfo revisions.
Debugging BitBake
It is not common to have to debug BitBake itself, but you may find a bug in BitBake and want to explore it by yourself before reporting it to the BitBake community. For such cases, you can ask BitBake to output the debug information at three different levels with the -D flag. To display all the debug information, run the following command:
$ bitbake -DDD <target>Error reporting tool
Sometimes, you will find a build error on a Yocto recipe that you have not modified. The first place to check for errors is the community itself, but before launching your mail client, head to http://errors.yoctoproject.org. The welcome page is displayed as follows:
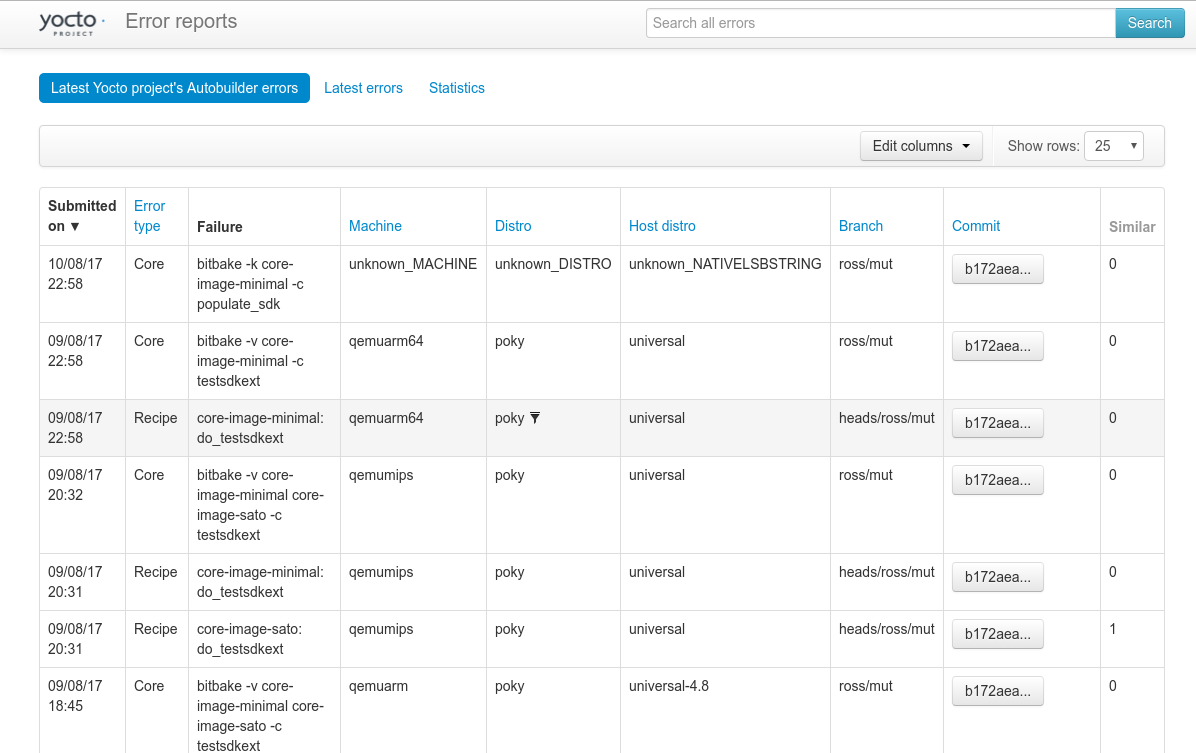
Error reporting web interface
This is a central database of mostly autobuilder, but also user-reported, errors. Here, you may check whether someone else is experiencing the same problem.
You can submit your own build failure to the database to help the community debug the problem. To do so, you may use the report-error class. Add the following to your conf/local.conf file:
INHERIT += "report-error"
By default, the error information is stored under tmp/log/error-report under the build directory, but you can set a specific location with the ERR_REPORT_DIR variable.
When the error reporting tool is activated, a build error will be captured in a file in the error-report folder. The build output will also print a command to send the error log to the server:
$ send-error-report ${LOG_DIR}/error-report/error-report_${TSTAMP}When this command is executed, it will report back with a link to the upstream error.
You can set up a local error server, and use that instead by passing a server argument. The error server code is a Django web application and setting up details can be found at http://git.yoctoproject.org/cgit/cgit.cgi/error-report-web/tree/README.