
Using wizards to build dashboards
Since the goal of this chapter is understanding Splunk dashboards (and not the fundamentals of searching), we'll utilize several new simple search strings as well as some of the queries from previous chapters to illustrate certain points. So, let's start by making an operational dashboard for showing Forecast Events within our indexed data. The following is a simple search string to begin our exercise:
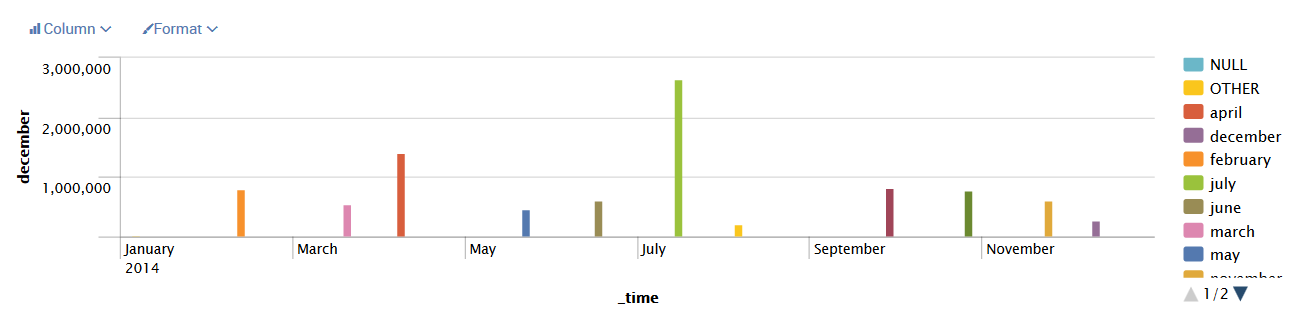
sourcetype="*" Forecast | timechart count as "Forecast Events" by
 date_month
This is shown in the following screenshot:

In addition to our search string, I've selected Previous Year from the Splunk presets (see the preceding screenshot).
This will produce a graph like this one:
To add this to a dashboard, we can perform the following steps:
- Click on
Save Asand then chooseDashboard Panel:
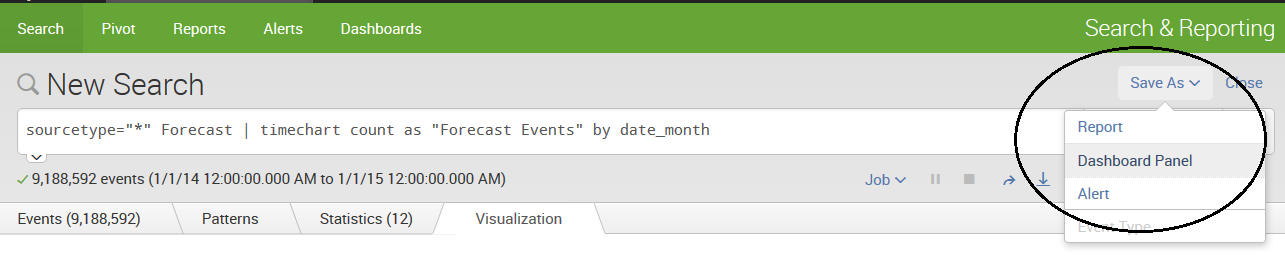
- This opens a dialog that guides you through saving the query as a dashboard:
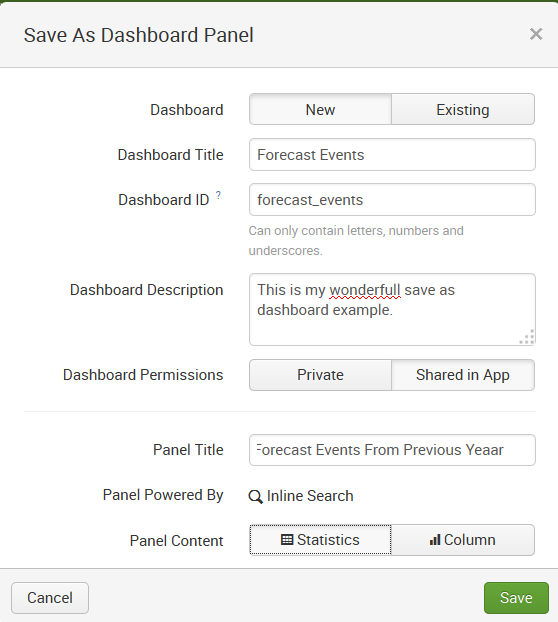
- Enter the following details and click on the
Savebutton:Dashboard-New/Existing: This allows you...