Search icon CANCEL
Subscription
0
Cart icon
Your Cart (0 item)
Close icon
You have no products in your basket yet
Save more on your purchases! discount-offer-chevron-icon
Savings automatically calculated. No voucher code required.
Arrow left icon
All Products
Best Sellers
New Releases
Books
Videos
Audiobooks
Learning Hub
Newsletter Hub
Free Learning
Arrow right icon
timer SALE ENDS IN
0 Days
:
00 Hours
:
00 Minutes
:
00 Seconds
Arrow up icon
GO TO TOP
Learning Qlik Sense: The Official Guide

You're reading from   Learning Qlik Sense: The Official Guide Get to grips with the vision of Qlik Sense for next generation business intelligence and data discovery

Arrow left icon
Product type Paperback
Published in Feb 2015
Publisher
ISBN-13 9781782173359
Length 230 pages
Edition 1st Edition
Languages
Arrow right icon
Authors (3):
Arrow left icon
Christopher Ilacqua Christopher Ilacqua
Author Profile Icon Christopher Ilacqua
Christopher Ilacqua
Henric Cronström Henric Cronström
Author Profile Icon Henric Cronström
Henric Cronström
James Richardson James Richardson
Author Profile Icon James Richardson
James Richardson
Arrow right icon
View More author details
Toc

Table of Contents (20) Chapters Close

Learning Qlik® Sense The Official Guide
Credits
About the Authors
Acknowledgments
About the Reviewer
www.packtpub.com
Preface
1. Why Develop Qlik Sense? FREE CHAPTER 2. What is Data Discovery? 3. The Vision of Qlik Sense 4. Overview of a Qlik Sense Application's Life Cycle 5. Empowering Next Generation Data Discovery Consumers 6. Contributing to Data Discovery 7. Creating Engaging Applications 8. Administering Qlik Sense 9. Sales Discovery 10. Human Resource Discovery 11. Travel Expense Discovery 12. Demographic Data Discovery Index

The user interface – sheets and visualizations


Once you have loaded the data into Qlik Sense, it is time to create the visualizations in the graphical user interface. A basic set of sheets and visualizations should normally be supplied by the application developer, and additional ones can be created by the users themselves.

Creating a sheet

Perform the following steps to create a sheet:

  1. Create an empty sheet from App overview, as shown in the next screenshot. So, if you have Data load editor open, you need to click on App overview:
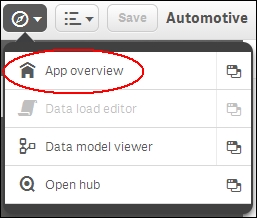
    The App overview command

  2. In App overview, you can create your first sheet by clicking on the sheet placeholder with a plus sign, as shown in the following screenshot:
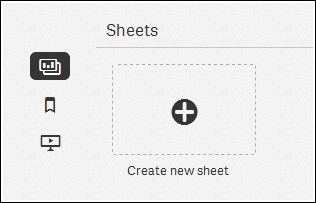
    The Create new sheet button

  3. Name it and hit Enter. You have now created an empty sheet and need to put some visualizations on it.

Adding visualizations

Perform the following steps to add visualizations:

  1. Click on the newly created sheet. You are now looking at the empty sheet, but you have probably figured...

lock icon The rest of the chapter is locked
Register for a free Packt account to unlock a world of extra content!
A free Packt account unlocks extra newsletters, articles, discounted offers, and much more. Start advancing your knowledge today.
Unlock this book and the full library FREE for 7 days
Get unlimited access to 7000+ expert-authored eBooks and videos courses covering every tech area you can think of
Renews at £13.99/month. Cancel anytime
Visually different images