
Using Kibana to visualize aggregations
In this section, we will discuss how to use Kibana to visualize aggregations. We will demonstrate a very simple bar chart to represent the terms aggregation. To use an index in Kibana, we have to add the index pattern to Kibana. To do this, perform the following steps:
- Go to the
Managementtab on the left. - Choose
Index Pattern, and you should see a screen similar to the following:
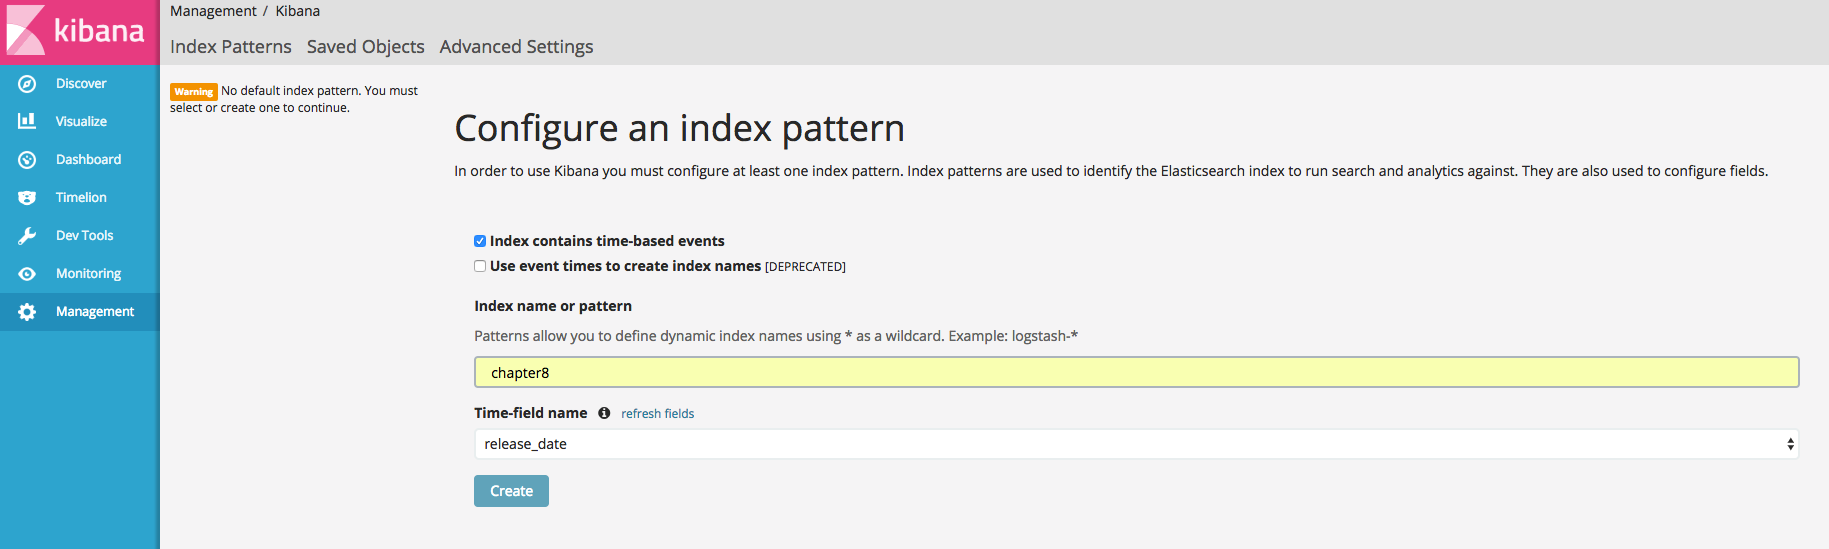
Input the index name or index pattern you would like to run the visualizations on. If you input an index pattern with a wildcard such as chapter*, all the indices that start with the name chapter are included in the visualization. Once you click on create, the next screen should show you the mappings of the index. If the mappings look OK, perform the following steps to create a new visualization:
- Go to the
Visualizetab on the left. - In the Create New Visualization screen, you can choose the type of visualization you would like. For this example, let's choose a
vertical bar chart...