Search icon CANCEL
Subscription
0
Cart icon
Your Cart (0 item)
Close icon
You have no products in your basket yet
Save more on your purchases! discount-offer-chevron-icon
Savings automatically calculated. No voucher code required.
Arrow left icon
All Products
Best Sellers
New Releases
Books
Videos
Audiobooks
Learning Hub
Newsletter Hub
Free Learning
Arrow right icon
timer SALE ENDS IN
0 Days
:
00 Hours
:
00 Minutes
:
00 Seconds
Arrow up icon
GO TO TOP
Implementing Oracle Integration Cloud Service

You're reading from   Implementing Oracle Integration Cloud Service Click here to enter text.

Arrow left icon
Product type Paperback
Published in Jan 2017
Publisher Packt
ISBN-13 9781786460721
Length 506 pages
Edition 1st Edition
Arrow right icon
Author (1):
Arrow left icon
Robert van Molken Robert van Molken
Author Profile Icon Robert van Molken
Robert van Molken
Arrow right icon
View More author details
Toc

Table of Contents (21) Chapters Close

Implementing Oracle Integration Cloud Service
Credits
Foreword
About the Authors
About the Reviewer
www.PacktPub.com
Customer Feedback
Preface
1. Introducing the Concepts and Terminology FREE CHAPTER 2. Integrating Our First Two Applications 3. Distribute Messages Using the Pub-Sub Model 4. Integrations between SaaS Applications 5. Going Social with Twitter and Google 6. Creating Complex Transformations 7. Routing and Filtering 8. Publish and Subscribe with External Applications 9. Managed File Transfer with Scheduling 10. Advanced Orchestration with Branching and Asynchronous Flows 11. Calling an On-Premises API 12. Are My Integrations Running Fine, and What If They Are Not? 13. Where Can I Go from Here?

Dashboard


The dashboard is the home screen for all monitoring activities for ICS. From the perspective of someone concerned with the health of a production instance of ICS, this is a great tool, but in a development context the dashboard view is going to be of relatively limited value and you will need to drill into the detail to see how the integration(s) you are working on are performing.

It is worth noting that the dashboard and the majority of views that represent aggregated data will have a drop down menu that allows you to view data over several time periods, which are:

  • Last 1 Hour

  • Last 6 Hours

  • Last 1 Day

  • Last 2 Days

  • Last 3 Days

  • Since First Activation

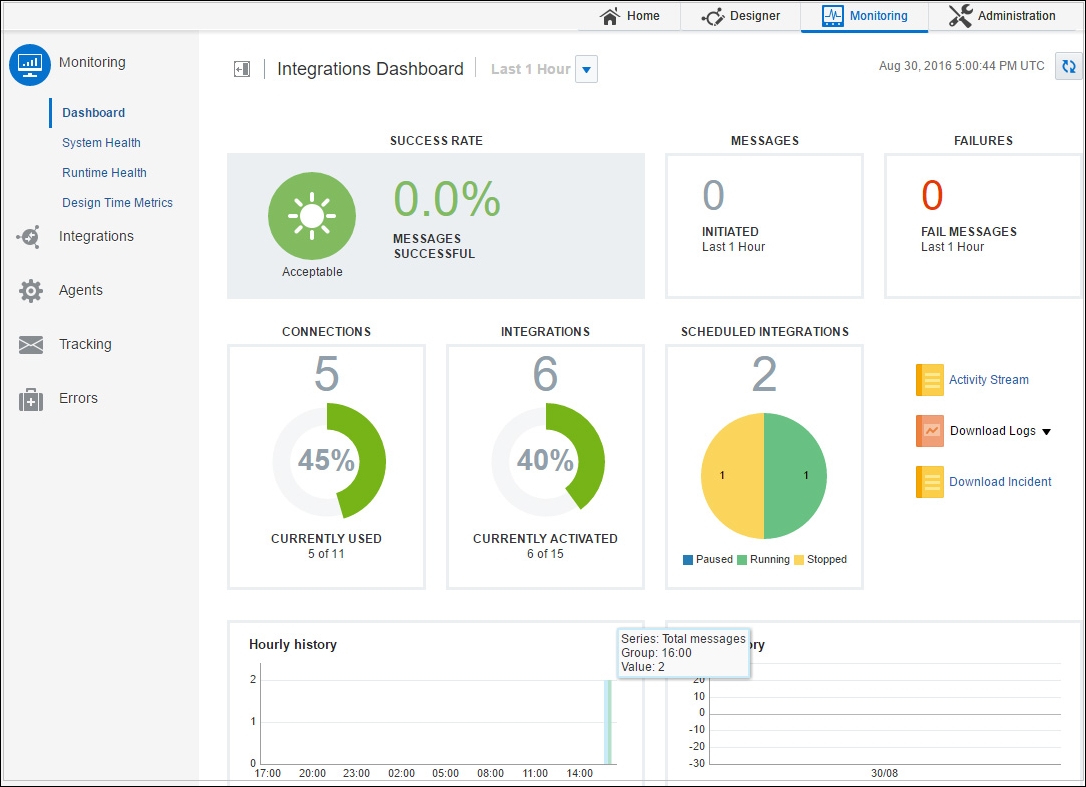
As you can see in the preceding screenshot, the Integration Dashboard comprises a menu to access more detailed views on the left and a set of largely graphical status views on the right. The left-hand side can be characterized as three rows of aggregated statistics. The top row describes how well those integrations that have been...

lock icon The rest of the chapter is locked
Register for a free Packt account to unlock a world of extra content!
A free Packt account unlocks extra newsletters, articles, discounted offers, and much more. Start advancing your knowledge today.
Unlock this book and the full library FREE for 7 days
Get unlimited access to 7000+ expert-authored eBooks and videos courses covering every tech area you can think of
Renews at £13.99/month. Cancel anytime
Visually different images