Checking VCSA performance using the GUI
We have seen that we can monitor performance from the VCSA command line using vimtop. For a more graphical view, we can log into the VCSA GUI and look at the performance graphs.
Getting ready
To step through this recipe you must have a running VCSA and access to the VCSA web client. No other prerequisites are required.
How to do it...
We will now log in to the VCSA management page to look at its performance:
- Open a web browser and go to
https://<VCSA management IP>:5480. - Log in as the root with the root password.
- Click on
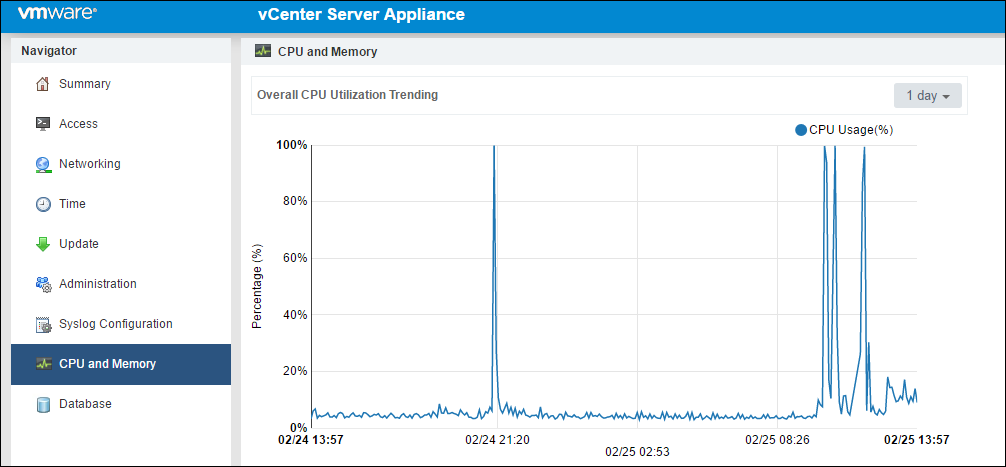
CPU and Memory. - These graphs give a
CPU and Memorygraph based on the intervals of 1 day, 1 week, 1 month, or 1 quarter. The graphs are not customizable but should give you an overview of the performance of your VCSA:
- Now click on the
Databasetab on the left.
This page will show the amount of database usage for Alarms, Events, Tasks, and Stats, as well as the remaining free space:
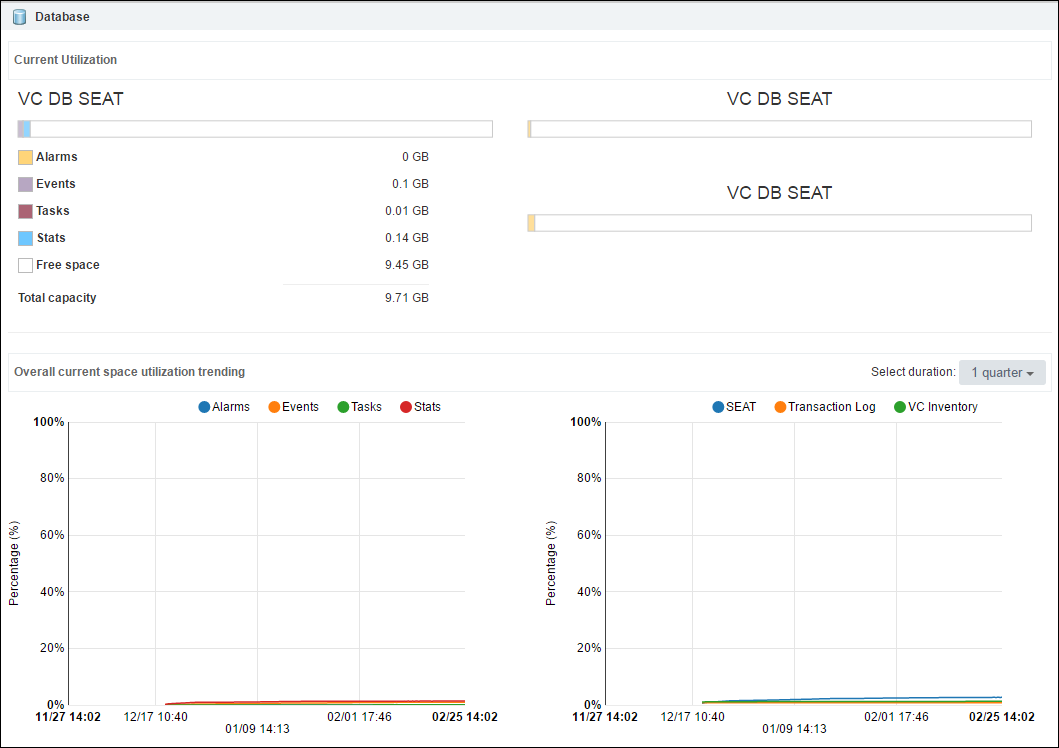
The page also has graphs for estimating when your database...