Search icon CANCEL
Subscription
0
Cart icon
Your Cart (0 item)
Close icon
You have no products in your basket yet
Save more on your purchases! discount-offer-chevron-icon
Savings automatically calculated. No voucher code required.
Arrow left icon
All Products
Best Sellers
New Releases
Books
Videos
Audiobooks
Learning Hub
Newsletter Hub
Free Learning
Arrow right icon
timer SALE ENDS IN
0 Days
:
00 Hours
:
00 Minutes
:
00 Seconds
Arrow up icon
GO TO TOP
SQL Server 2016 Reporting Services Cookbook

You're reading from   SQL Server 2016 Reporting Services Cookbook Your one-stop guide to operational reporting and mobile dashboards using SSRS 2016

Arrow left icon
Product type Paperback
Published in Nov 2016
Publisher Packt
ISBN-13 9781786461810
Length 596 pages
Edition 1st Edition
Languages
Arrow right icon
Authors (2):
Arrow left icon
 Priyankara Priyankara
Author Profile Icon Priyankara
Priyankara
Robert Cain Robert Cain
Author Profile Icon Robert Cain
Robert Cain
Arrow right icon
View More author details
Toc

Table of Contents (18) Chapters Close

SQL Server 2016 Reporting Services Cookbook
Credits
About the Authors
About the Reviewers
www.Packtpub.com
Preface
1. Getting It Ready – Configuring Reporting Services FREE CHAPTER 2. Authoring Reports with SQL Server Data Tools 3. Advanced Report Authoring with SQL Server Data Tools 4. Authoring Reports with Report Builder 5. Improving User Experience – New Designing and Visualization Enhancements 6. Authoring Reports with the Mobile Report Publisher 7. Consuming Reports – Report Access Enhancement 8. Reporting Solutions for BI – Integration 9. SharePoint Integration 10. Administering and Managing Reporting Services 11. Securing Reports in Reporting Services 12. Custom Programming and Integration to .NET Applications

Visualizing data with the Sunburst data region


The Sunburst data region functions similarly to TreeMap. It is a great visualization for hierarchical data set with summarized values and it uses circles instead of rectangles.

The Sunburst forms a series of circles to represent levels of the hierarchy. The highest level of the hierarchy is set with the inner circle and lower levels of the hierarchy are formed outside the inner circle as rings. Multiple rings represent multiple levels.

The following chart shows a hierarchical data set with the Sunburst data region:
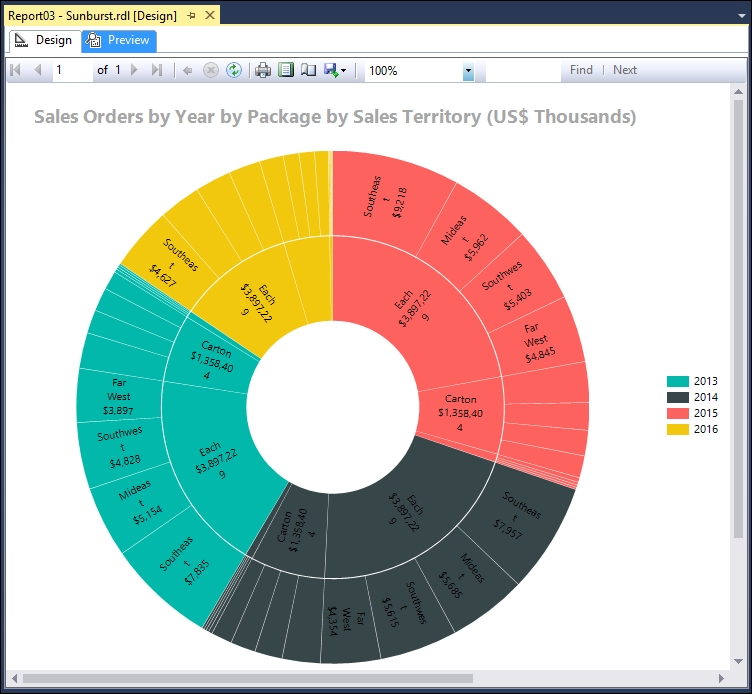
Figure 5.19

You can find this report in Chapter05 solution as Report03 - Sunburst.

Getting ready

Let's make a report with the Sunburst data region. Follow these steps for preparing the project for a new report:

  1. Add a new report to your Reporting Services solution and name it  Sales Orders by Year by Package by Sales Territory (US$ Thousands).

  2. Make a data set using the following query. Make sure the data set is connected to the WideWorldImportersDW...

lock icon The rest of the chapter is locked
Register for a free Packt account to unlock a world of extra content!
A free Packt account unlocks extra newsletters, articles, discounted offers, and much more. Start advancing your knowledge today.
Unlock this book and the full library FREE for 7 days
Get unlimited access to 7000+ expert-authored eBooks and videos courses covering every tech area you can think of
Renews at $15.99/month. Cancel anytime
Visually different images