
A linear model in the presence of outliers
In this recipe, instead of traditional linear regression we will try using the Theil-Sen estimator to deal with some outliers.
Getting ready
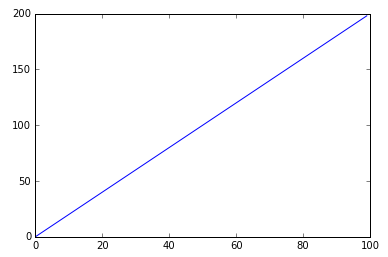
First, create the data corresponding to a line with a slope of 2:
import numpy as np
import matplotlib.pyplot as plt
%matplotlib inline

num_points = 100
x_vals = np.arange(num_points)
y_truth = 2 * x_vals
plt.plot(x_vals, y_truth)
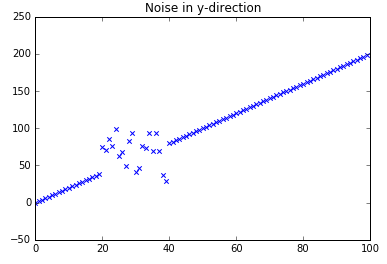
Add noise to that data and label it as y_noisy:
y_noisy = y_truth.copy()
#Change y-values of some points in the line
y_noisy[20:40] = y_noisy[20:40] * (-4 * x_vals[20:40]) - 100

plt.title("Noise in y-direction")
plt.xlim([0,100])
plt.scatter(x_vals, y_noisy,marker='x')
How to do it...
- Import both
LinearRegressionandTheilSenRegressor. Score the estimators using the original line as the testing set,y_truth:
from sklearn.linear_model import LinearRegression, TheilSenRegressor
from sklearn.metrics import r2_score, mean_absolute_error

named_estimators = [('OLS ', LinearRegression()), ('TSR...