


Creating a time series MultiPlot with Bokeh-Scala
In this second recipe on plotting using Bokeh, we'll see how to plot a time series graph with a dataset borrowed from https://archive.ics.uci.edu/ml/datasets/Dow+Jones+Index. We will also see how to plot multiple charts in a single document.
How to do it...
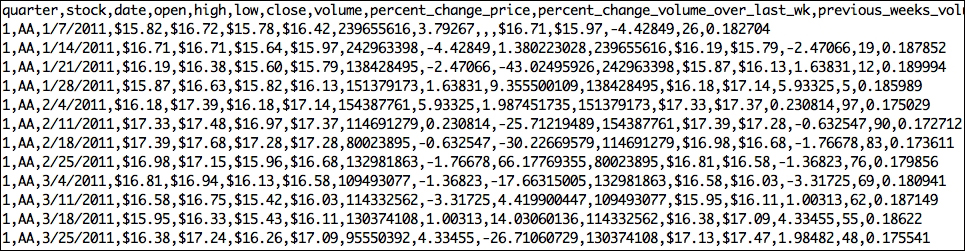
We'll be using only two fields from the dataset: the closing price of the stock at the end of the week, and the last business day of the week. Our dataset is comma separated. Let's take a look at some samples, as shown here:
Preparing our data
In contrast to the previous recipe, where we used the Breeze matrix to construct the Bokeh ColumnDataSource, we'll use the Spark DataFrame to construct the source this time. The getSource method accepts a ticker (MSFT-Microsoft and CAT-Caterpillar) and a SQLContext. It runs a Spark SQL, fetches the data from the table, and constructs a ColumnDataSource from it:
import org.joda.time.format.DateTimeFormat

object StockSource {

  val formatter = DateTimeFormat...


