Search icon CANCEL
Subscription
0
Cart icon
Your Cart (0 item)
Close icon
You have no products in your basket yet
Save more on your purchases! discount-offer-chevron-icon
Savings automatically calculated. No voucher code required.
Arrow left icon
All Products
Best Sellers
New Releases
Books
Videos
Audiobooks
Learning Hub
Newsletter Hub
Free Learning
Arrow right icon
timer SALE ENDS IN
0 Days
:
00 Hours
:
00 Minutes
:
00 Seconds
Arrow up icon
GO TO TOP
PostGIS Cookbook

You're reading from   PostGIS Cookbook Store, organize, manipulate, and analyze spatial data

Arrow left icon
Product type Paperback
Published in Mar 2018
Publisher
ISBN-13 9781788299329
Length 584 pages
Edition 2nd Edition
Languages
Tools
Arrow right icon
Authors (6):
Arrow left icon
 Vincent Mather Vincent Mather
Author Profile Icon Vincent Mather
Vincent Mather
Pedro Wightman Pedro Wightman
Author Profile Icon Pedro Wightman
Pedro Wightman
 Park Park
Author Profile Icon Park
Park
Thomas Kraft Thomas Kraft
Author Profile Icon Thomas Kraft
Thomas Kraft
Mayra Zurbarán Mayra Zurbarán
Author Profile Icon Mayra Zurbarán
Mayra Zurbarán
 Corti Corti
Author Profile Icon Corti
Corti
+2 more Show less
Arrow right icon
View More author details
Toc

Table of Contents (18) Chapters Close

Title Page
Packt Upsell
Contributors
Preface
1. Moving Data In and Out of PostGIS 2. Structures That Work FREE CHAPTER 3. Working with Vector Data – The Basics 4. Working with Vector Data – Advanced Recipes 5. Working with Raster Data 6. Working with pgRouting 7. Into the Nth Dimension 8. PostGIS Programming 9. PostGIS and the Web 10. Maintenance, Optimization, and Performance Tuning 11. Using Desktop Clients 12. Introduction to Location Privacy Protection Mechanisms 1. Other Books You May Enjoy Index

Translating, scaling, and rotating geometries – advanced


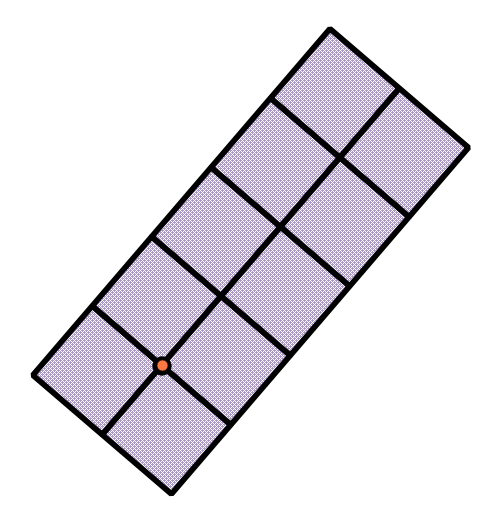
Often, in a spatial database, we are interested in making explicit the representation of geometries that are implicit in the data. In the example that we will use here, the explicit portion of the geometry is a single point coordinate where a field survey plot has taken place. In the following screenshot, this explicit location is the dot. The implicit geometry is the actual extent of the field survey, which includes 10 subplots arranged in a 5 x 2 array and rotated according to a bearing.

These subplots are the purple squares in the following diagram:

Getting ready

There are a number of ways for us to approach this problem. In the interest of simplicity, we will first construct our grid and then rotate it in place. Also, we could in principle use a ST_Buffer function in combination with ST_Extent to construct the squares in our resultant geometry, but, as ST_Extent uses floating-point approximations of the geometry for the sake of efficiency...

lock icon The rest of the chapter is locked
Register for a free Packt account to unlock a world of extra content!
A free Packt account unlocks extra newsletters, articles, discounted offers, and much more. Start advancing your knowledge today.
Unlock this book and the full library FREE for 7 days
Get unlimited access to 7000+ expert-authored eBooks and videos courses covering every tech area you can think of
Renews at $15.99/month. Cancel anytime
Visually different images