Search icon CANCEL
Subscription
0
Cart icon
Your Cart (0 item)
Close icon
You have no products in your basket yet
Save more on your purchases! discount-offer-chevron-icon
Savings automatically calculated. No voucher code required.
Arrow left icon
All Products
Best Sellers
New Releases
Books
Videos
Audiobooks
Learning Hub
Newsletter Hub
Free Learning
Arrow right icon
timer SALE ENDS IN
0 Days
:
00 Hours
:
00 Minutes
:
00 Seconds
Arrow up icon
GO TO TOP
Mastering Spark for Data Science

You're reading from   Mastering Spark for Data Science Lightning fast and scalable data science solutions

Arrow left icon
Product type Paperback
Published in Mar 2017
Publisher Packt
ISBN-13 9781785882142
Length 560 pages
Edition 1st Edition
Arrow right icon
Authors (5):
Arrow left icon
 Bifet Bifet
Author Profile Icon Bifet
Bifet
 Morgan Morgan
Author Profile Icon Morgan
Morgan
 Amend Amend
Author Profile Icon Amend
Amend
 Hallett Hallett
Author Profile Icon Hallett
Hallett
 George George
Author Profile Icon George
George
+1 more Show less
Arrow right icon
View More author details
Toc

Table of Contents (22) Chapters Close

Mastering Spark for Data Science
Credits
Foreword
About the Authors
About the Reviewer
www.PacktPub.com
Customer Feedback
Preface
1. The Big Data Science Ecosystem FREE CHAPTER 2. Data Acquisition 3. Input Formats and Schema 4. Exploratory Data Analysis 5. Spark for Geographic Analysis 6. Scraping Link-Based External Data 7. Building Communities 8. Building a Recommendation System 9. News Dictionary and Real-Time Tagging System 10. Story De-duplication and Mutation 11. Anomaly Detection on Sentiment Analysis 12. TrendCalculus 13. Secure Data 14. Scalable Algorithms

The TrendCalculus algorithm


In this section we will explain the detail of the TrendCalculus implementation, using the Brent oil price data set seen in Chapter 5, Spark for Geographic Analysis, as an example use case.

Trend windows

In order to measure any type of change, we must first quantify it in some way. For trends, we are going to define this in the following manner:

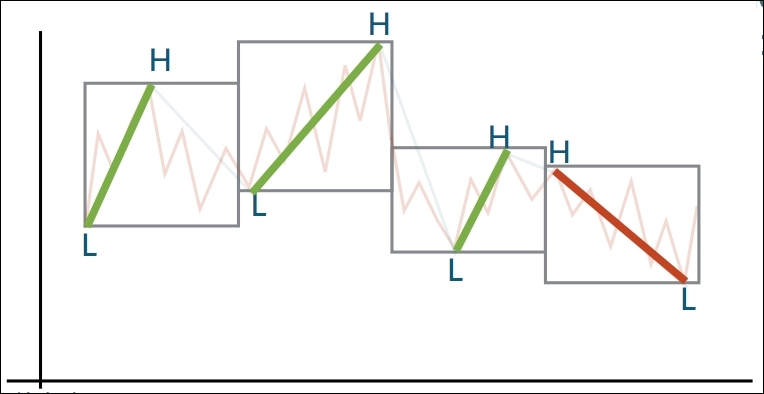
  • Overall positive change (usually expressed as a value increase)

Higher highs and higher lows => +1

  • Overall negative change (usually expressed as a value decrease)

Lower highs and lower lows => -1

We must therefore translate our data into a time series of trend direction, being either +1 or -1. By splitting our data into a series of windows, size n, we can calculate the dated highs and lows for each of them:

Since this type of windowing is a common practice in data science, it is reasonable to think there must be an implementation in Spark; if you have read Chapter 5, Spark for Geographic Analysis you will have seen them...

lock icon The rest of the chapter is locked
Register for a free Packt account to unlock a world of extra content!
A free Packt account unlocks extra newsletters, articles, discounted offers, and much more. Start advancing your knowledge today.
Unlock this book and the full library FREE for 7 days
Get unlimited access to 7000+ expert-authored eBooks and videos courses covering every tech area you can think of
Renews at $15.99/month. Cancel anytime
Visually different images