Search icon CANCEL
Subscription
0
Cart icon
Your Cart (0 item)
Close icon
You have no products in your basket yet
Save more on your purchases! discount-offer-chevron-icon
Savings automatically calculated. No voucher code required.
Arrow left icon
All Products
Best Sellers
New Releases
Books
Videos
Audiobooks
Learning Hub
Newsletter Hub
Free Learning
Arrow right icon
timer SALE ENDS IN
0 Days
:
00 Hours
:
00 Minutes
:
00 Seconds
Arrow up icon
GO TO TOP
Mastering Python Data Visualization

You're reading from   Mastering Python Data Visualization Generate effective results in a variety of visually appealing charts using the plotting packages in Python

Arrow left icon
Product type Paperback
Published in Oct 2015
Publisher
ISBN-13 9781783988327
Length 372 pages
Edition 1st Edition
Languages
Arrow right icon
Author (1):
Arrow left icon
Kirthi Raman Kirthi Raman
Author Profile Icon Kirthi Raman
Kirthi Raman
Arrow right icon
View More author details
Toc

Table of Contents (16) Chapters Close

Mastering Python Data Visualization
Credits
About the Author
About the Reviewers
www.PacktPub.com
Preface
1. A Conceptual Framework for Data Visualization FREE CHAPTER 2. Data Analysis and Visualization 3. Getting Started with the Python IDE 4. Numerical Computing and Interactive Plotting 5. Financial and Statistical Models 6. Statistical and Machine Learning 7. Bioinformatics, Genetics, and Network Models 8. Advanced Visualization Go Forth and Explore Visualization Index

Linear regression


The main goal of using linear regression is to predict a numeric target value. One way to do this is to write an equation for the target value with respect to the inputs. For example, assume that we are trying to forecast the acceptance rate of a fully rounded student who participates in sports and music, but belongs to a low-income family.

One possible equation is acceptance = 0.0015*income + 0.49*(participation_score); this is a regression equation. This uses a simple linear regression to predict a quantitative response with a single feature. It takes the following form:

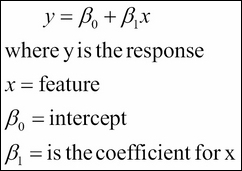
Together, β0 and β1 are called the model coefficients. To create our model, you must learn the values of these coefficients. Once you've learned these coefficients, you can use the model to predict the acceptance rate reasonably.

These coefficients are estimated using the least squares criteria, which means that we will find the separating line mathematically and minimize the sum of squared residuals. The...

lock icon The rest of the chapter is locked
Register for a free Packt account to unlock a world of extra content!
A free Packt account unlocks extra newsletters, articles, discounted offers, and much more. Start advancing your knowledge today.
Unlock this book and the full library FREE for 7 days
Get unlimited access to 7000+ expert-authored eBooks and videos courses covering every tech area you can think of
Renews at $15.99/month. Cancel anytime
Visually different images