Visualizing data per country and adding a tooltip
You learned to build a data-driven and -giving representation of your visual. You have also used it to highlight the country at hover. However, you haven’t really tapped into the plentiful options of interaction this gives you. Let’s do this now. There’s a lot you could do, but I think a tooltip would be a reasonable place to start.
Before we embark on the tooltip build, let’s add some more interesting data to the globe. So far, we have country name, country name abbreviation, and population estimate. That’s already something to work with. However, let’s task ourselves with adding an additional data source to our globe, visualize it appropriately, and add a sensible interaction for user exploration.
As a little reminder, this is what you will build:
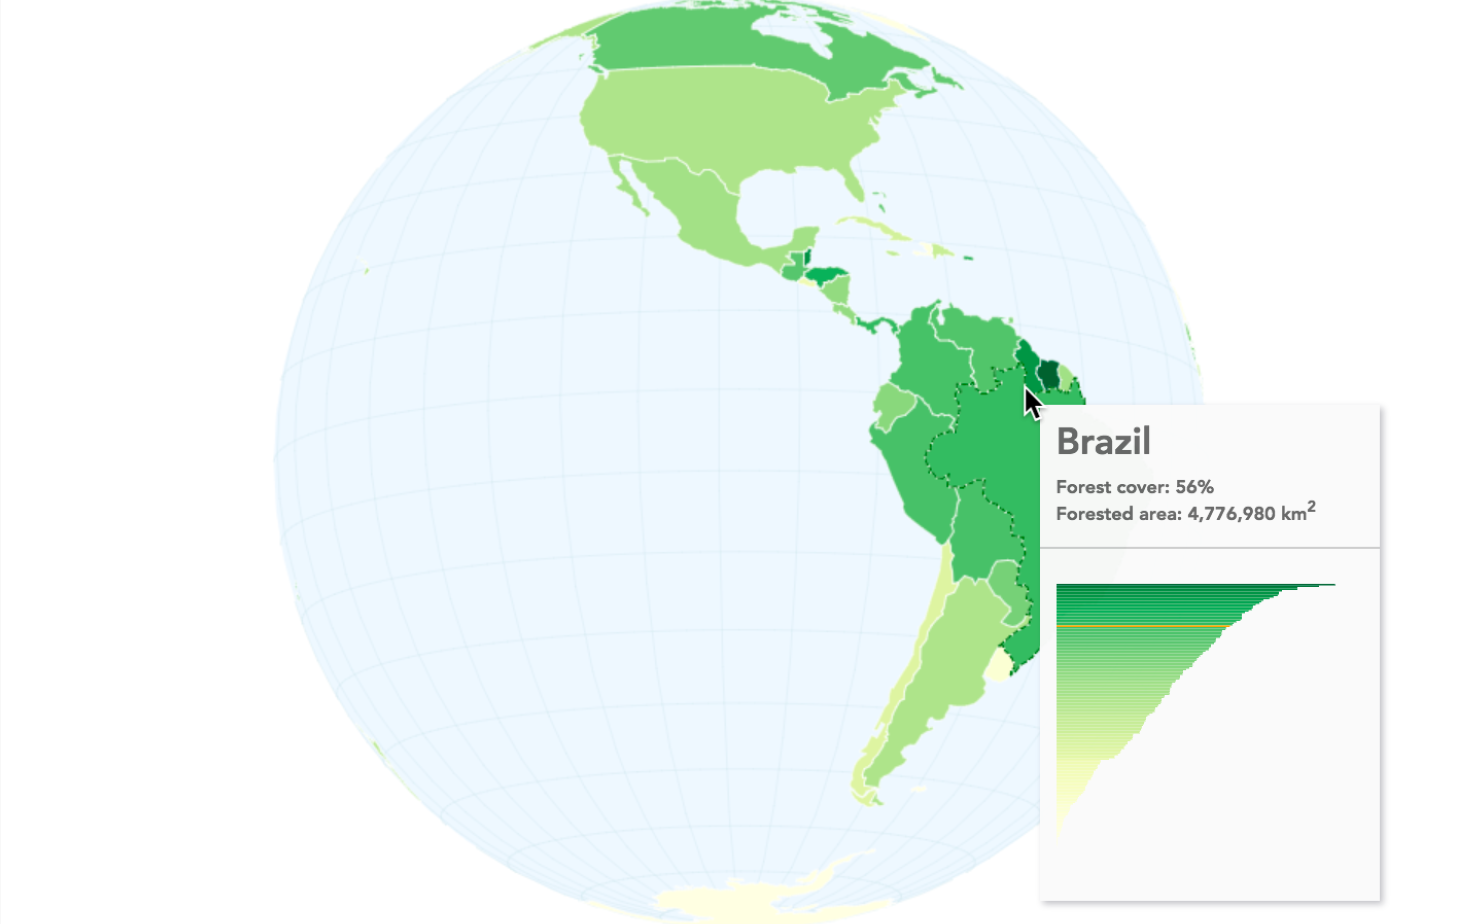
Our final Canvas adventure
Note
View the final app athttps://larsvers.github.io/learning-d3-mapping-10-4 and the code example at 10_04.html.
The preceding screenshot shows a globe visualization of forest...