Making a hexbin map
Having improved our US state choropleth map with hexagons, let’s now use hexagons to alter our dot density map. There are benefits to a dot density map as we have seen previously, so the changes we are about to make are more alterations than clear improvements. Here’s what we will build:
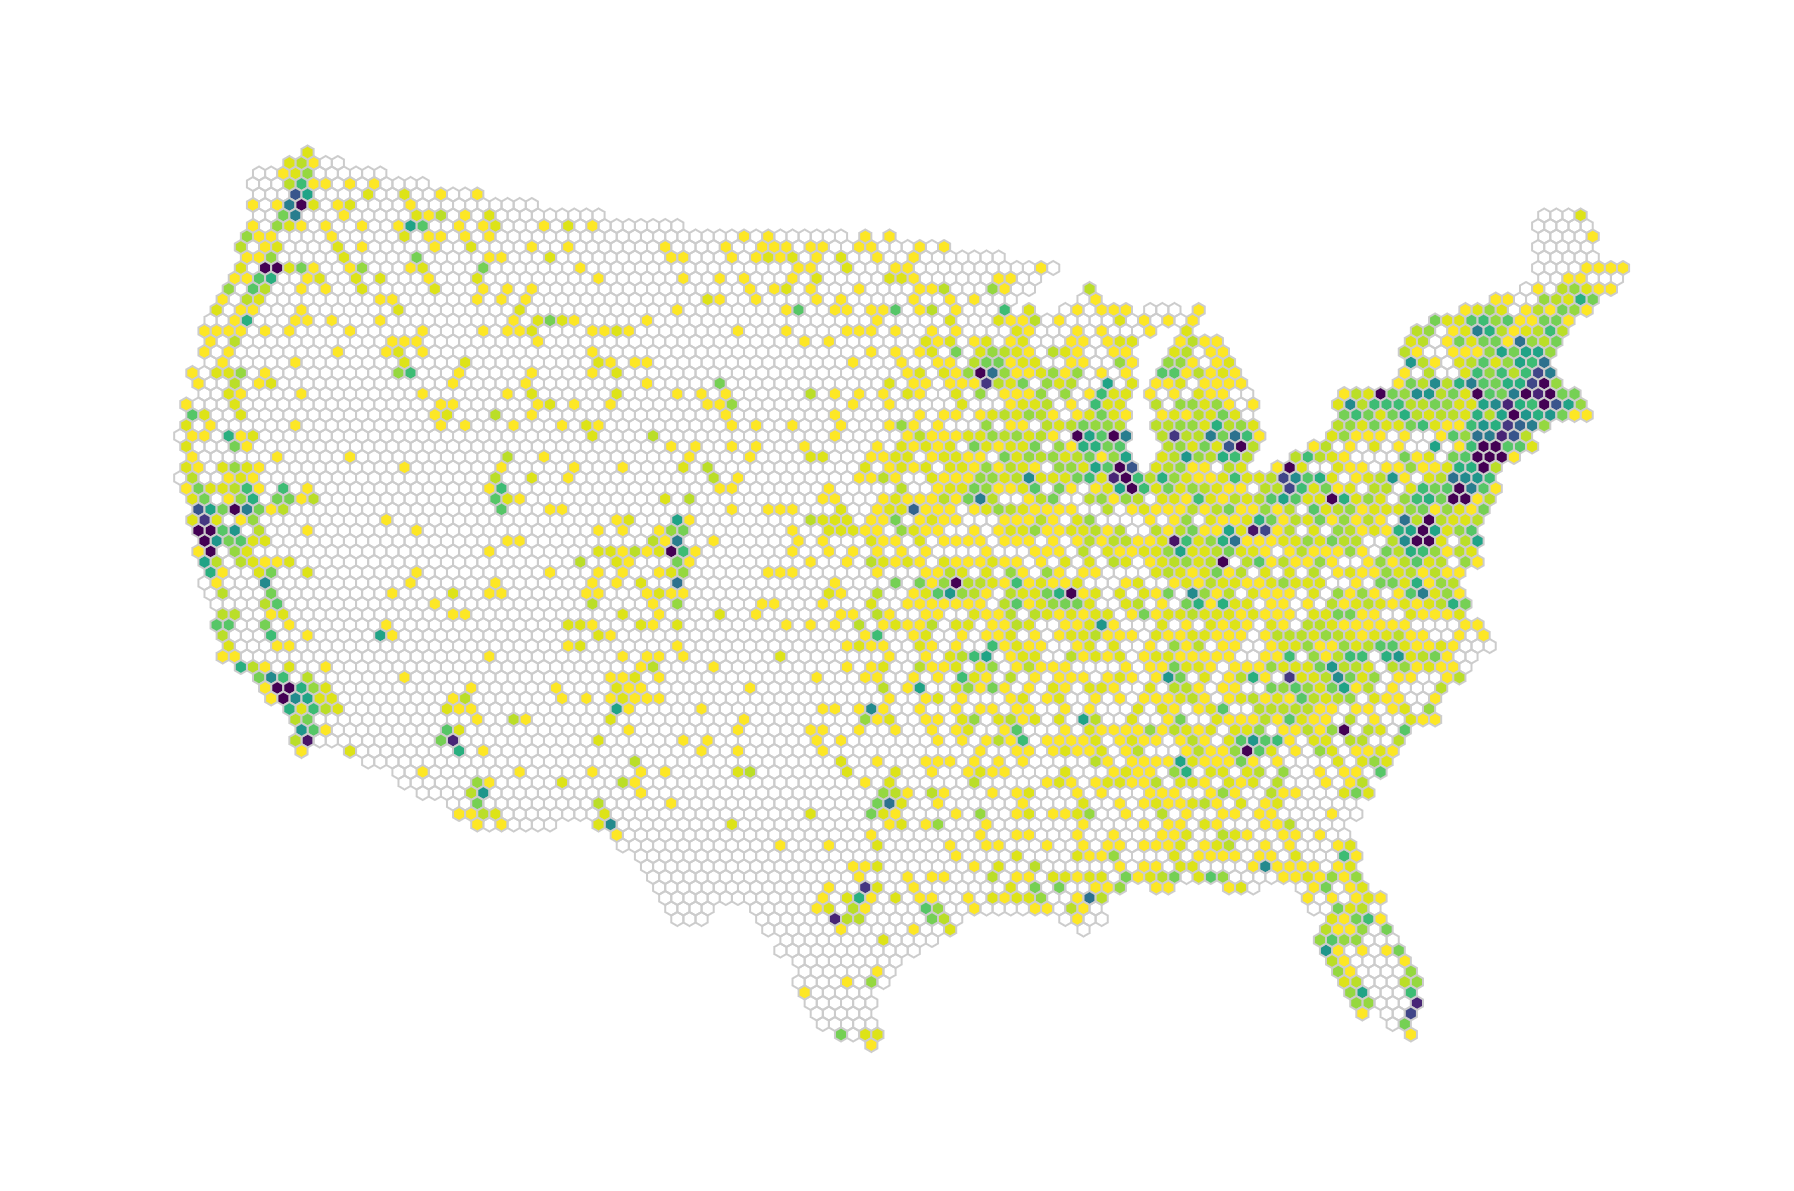
A map of many hexagons in color
It’s a hexbin map showing the farmers' markets hotspots. Areas with no farmers' markets are shown as white hexagons, areas with many farmers' markets are shown in blue to dark purple. Lighter and less saturated yellow and green hexagons represent areas with fewer markets.
Reviewing the hexbin algorithm
What do we want to achieve? There are two major steps we want to cover. First, we want to show the US as a hexagon tiling. Next, we want to highlight hexagons with farmers' markets, color encoding the number of markets within each hexagon.
Alternatively, we could be content with showing a map of the US and only display the hexagons where farmers' markets reside...