Drawing a Julia line graph using the Winston package
Another package for graphics in Julia is Winston. It has some of the capabilities of Gadfly and can produce similar plots.
How to do it...
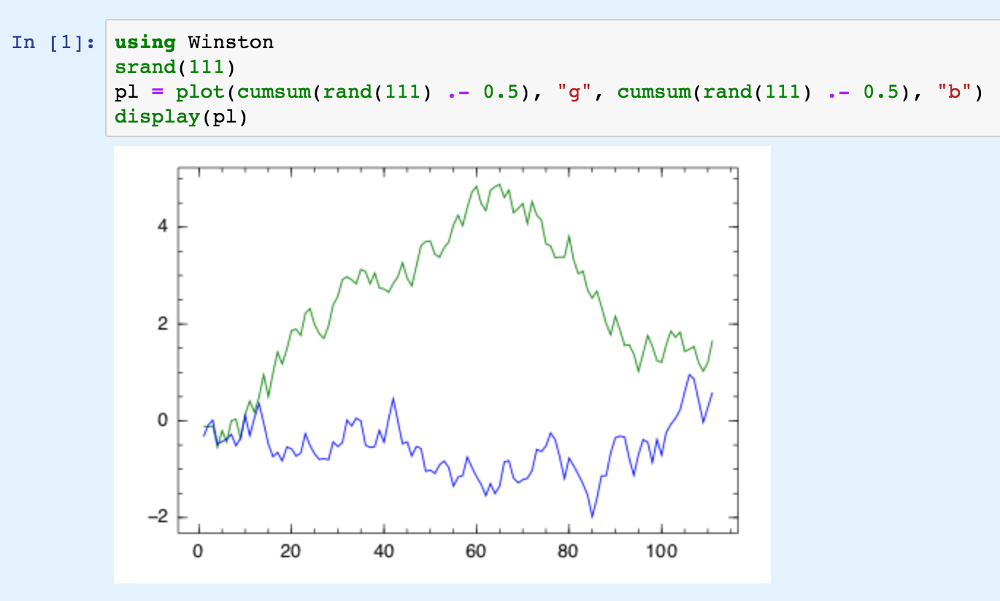
We can use this script:
using Winston
srand(111)

#generate a plot
pl = plot(cumsum(rand(111) .- 0.5), "g", cumsum(rand(111) .- 0.5), "b")

display(pl)
That produces this plot:
How it works...
We are plotting the cumulative sum of random points in a line graph.
Winston uses the idea of drawing to a plot and later actually displays the plot. This allows for adding legends, titles, and so on.