
State-of-the-art automated stock trading
Usually, in a security exchange, exchanges maintain order book lists of all buy and sell orders with their quantity and prices, and they execute them when a match is found between somebody buying and selling. In addition, exchanges keep and provide statistics about state trading, often captured as OHCL (short for, open-high-close-low) and volume for both currencies of a trader pair.
By the way, bar charts are used, showing open, high, low, and closing prices. Unlike line charts, OHLC charts enable technical analysts to evaluate intra-day volatility and see where prices opened and closed. Take a look at this diagram:
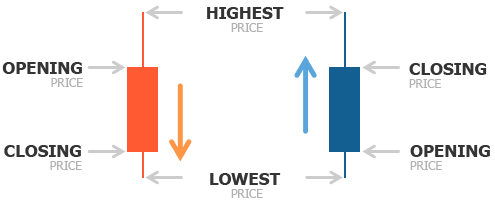
OHLC pricing model showing the open, high, low, and close prices of a certain time period (source: http://en.tradimo.com/tradipedia/ohlc-chart/)
This data is being presented as aggregated in some periods, from seconds to days, and even months. There are dedicated servers working on collecting this data for professional traders and institutions...