


Linking multiple plots together
At times, we might want our plots to have the same range of values along the x-and/or y-axes in order to facilitate meaningful comparison of the same range of points across different plots.
We will be working with plot1, plot2, and plot3 as illustrated in the sections before this.
In order to create multiple plots with the same range along the y-axis, we use the code shown here:
#Import the required packages

from bokeh.io import output_file, show
from bokeh.layouts import row

#Creating equal y axis ranges

plot3.y_range = plot1.y_range

#Create the row layout

row_layout = row(plot3, plot1)

#Output the plot

output_file('grid.html')

show(row_layout)
This results in a layout of plots as illustrated here:
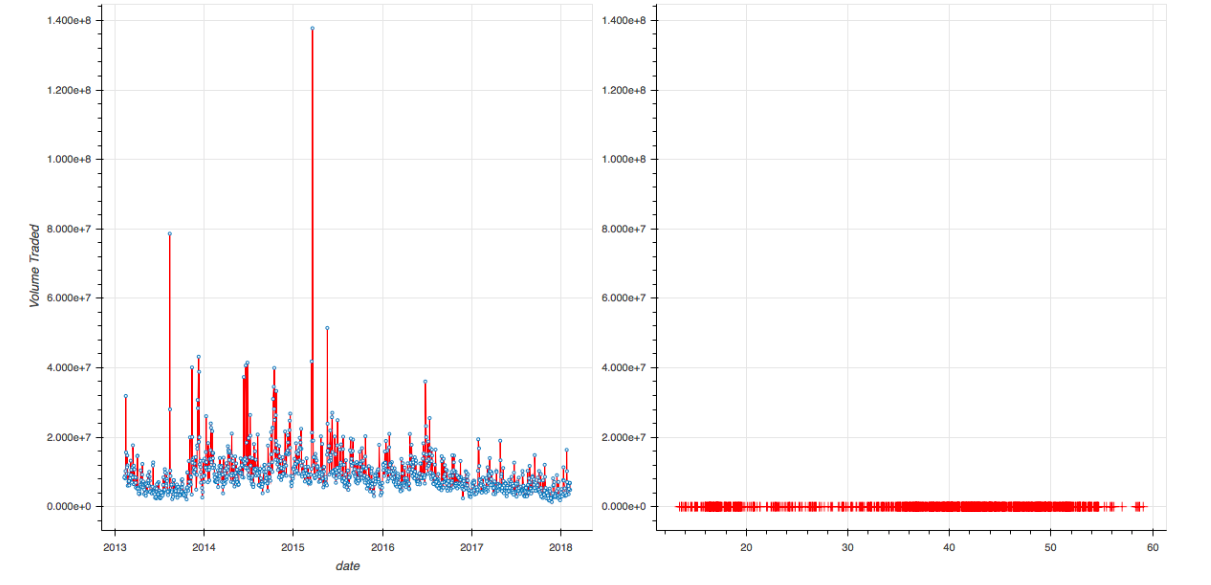
Plots 1 and 3 linked together by the same y axis range as plot 3
In the previous code, we gave plot1 the same y-range as plot3. In the resulting chart, you can observe how plot3 and plot1 have the exact same y-axis ranges. You can also see that with plot1...


