While the game is running, you can open the Gameplay Debugger (or Visual Debugger) by pressing the " ' " (apostrophe) key.
All the key bindings of the visual debugger can be changed/customized. We will see how we can change them in the Project Settings section, later in this chapter.
The Gameplay Debugger is divided into two: Extensions and Categories:
- Extensions are specific key bindings (toggles) that trigger a specific function.
- Categories are toggleable pieces of information that appear on the screen (and also in 3D spaces) in regards to a specific system
On-screen, the Gameplay Debugger is visually divided into two sections:
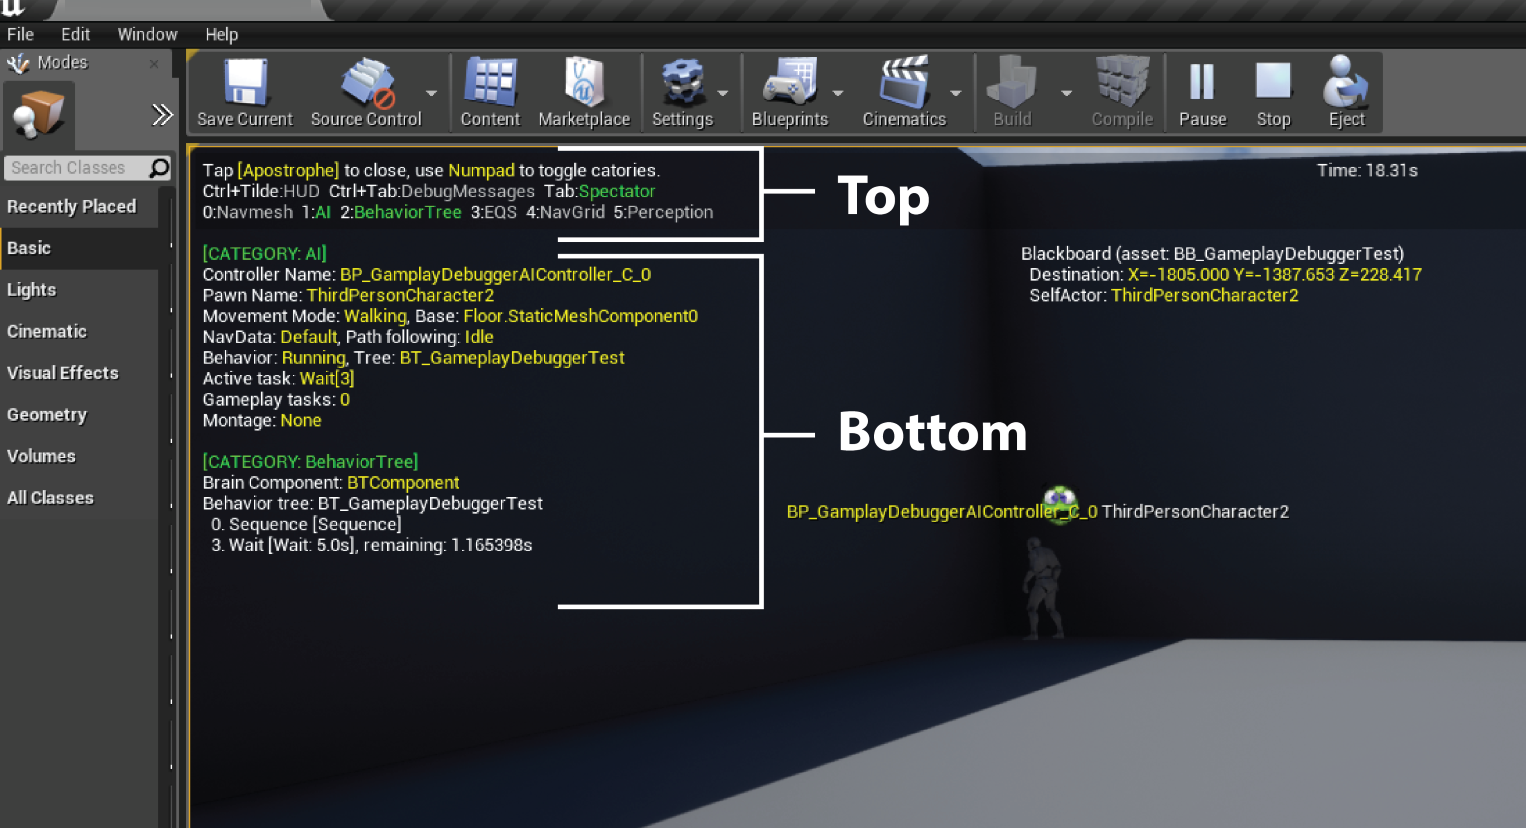
The top section is the control section and shows which options are available. In particular, it displays which Extensions are available and highlights the active Categories...