
Web analytics
Due to GitHub's nature, a repository contains a great deal of metadata, such as commits over time, who contributed what, the number of contributors, the number of forks, and even site referrals to various files.
GitHub provides some useful graphs and data, from which you can deduct the information you require under the Insights tab of a repository. Let's explore what's underneath.
Pulse
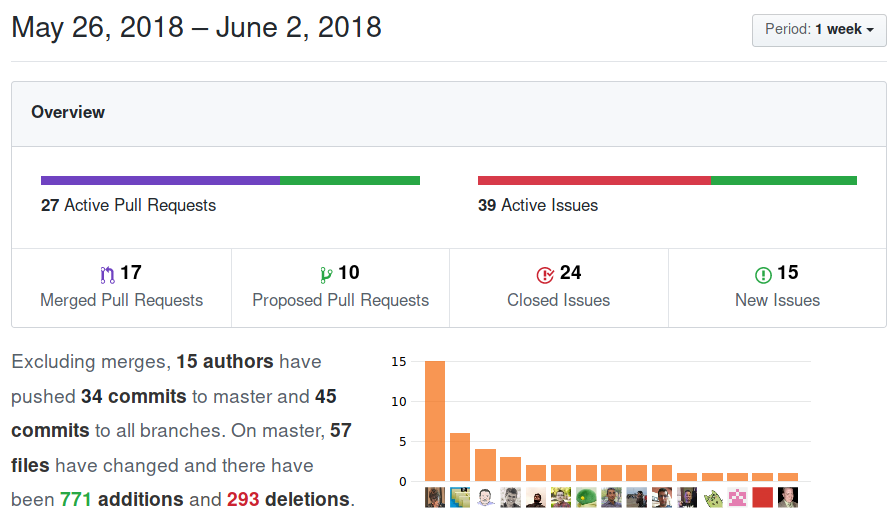
Pulse is an overview of a repository's activity. The default is to show the last week, but you can change the period from the drop-down menu on the right, by choosing 24 hours, 3 days, 1 week, or 1 month.
From here, you have a high-level overview of the merged and open pull requests, and open and closed issues, as well as the top committers for that period:
Contributors – additions/deletions
An overview of the top 100 contributors of a project can be seen at the Contributors tab. The graph is created by the data of the default branch of a repository and it depicts the commits from the beginning of...