Search icon CANCEL
Subscription
0
Cart icon
Your Cart (0 item)
Close icon
You have no products in your basket yet
Save more on your purchases! discount-offer-chevron-icon
Savings automatically calculated. No voucher code required.
Arrow left icon
All Products
Best Sellers
New Releases
Books
Videos
Audiobooks
Learning Hub
Newsletter Hub
Free Learning
Arrow right icon
timer SALE ENDS IN
0 Days
:
00 Hours
:
00 Minutes
:
00 Seconds
Arrow up icon
GO TO TOP
Docker for Serverless Applications

You're reading from   Docker for Serverless Applications Containerize and orchestrate functions using OpenFaas, OpenWhisk, and Fn

Arrow left icon
Product type Paperback
Published in Apr 2018
Publisher Packt
ISBN-13 9781788835268
Length 250 pages
Edition 1st Edition
Tools
Concepts
Arrow right icon
Author (1):
Arrow left icon
Chanwit Kaewkasi Chanwit Kaewkasi
Author Profile Icon Chanwit Kaewkasi
Chanwit Kaewkasi
Arrow right icon
View More author details
Toc

Table of Contents (15) Chapters Close

Title Page
Packt Upsell
Contributors
Preface
1. Serverless and Docker FREE CHAPTER 2. Docker and Swarm Clusters 3. Serverless Frameworks 4. OpenFaaS on Docker 5. The Fn Project 6. OpenWhisk on Docker 7. Operating FaaS Clusters 8. Putting Them All Together 9. The Future of Serverless 1. Other Books You May Enjoy Index

The OpenFaaS dashboard


A good OpenFaaS dashboard is available on the Grafana platform. To make Grafana work with OpenFaaS, the Grafana server must be on the same network. We can use the following command to run a Grafana server via docker service create outside the OpenFaaS stack. It links to the OpenFaaS stack via the --network=func_functions argument:

$ docker service create --name=grafana \
    --network=func_functions \
    -p 3000:3000 grafana/grafana

Alternatively, open the dashboard at http://localhost:3000. Log in using the username admin and password admin:

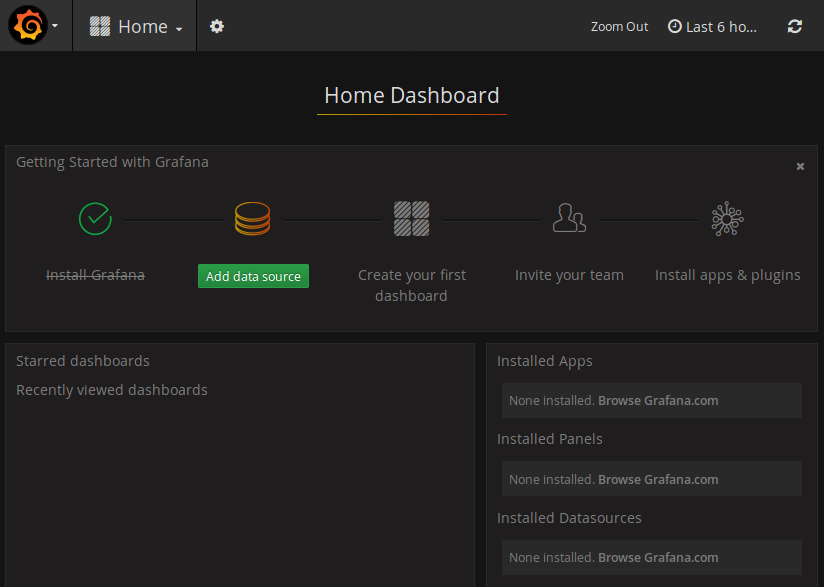
Figure 4.11: Grafana home dashboard 

A data source has to be created and pointed to the Prometheus server before using it as the source of a dashboard. Firstly, the data source name must be prometheus. Secondly, the URL needs to point to http://prometheus:9090. After that, we can click the Save and Test buttons. A green popup will be displayed if the data source setting is correct:

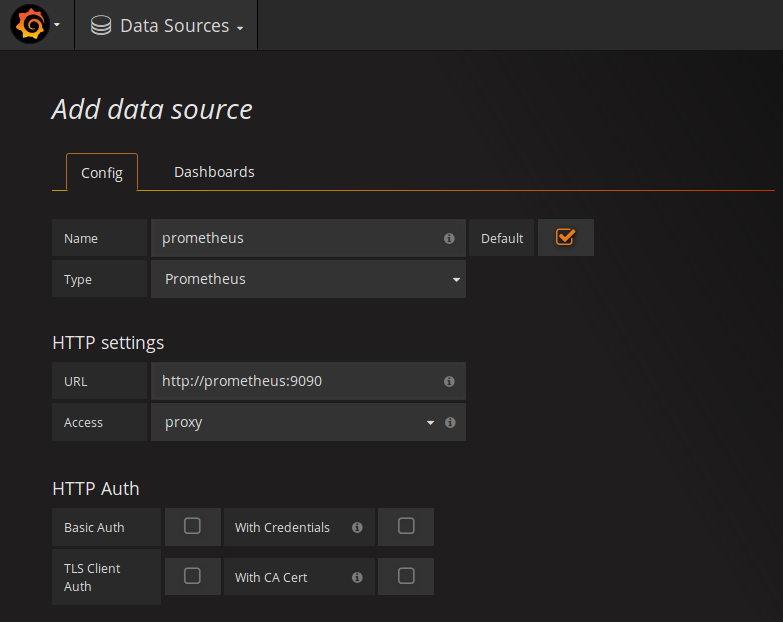
Figure 4.12: Defining a new Prometheus data source...

lock icon The rest of the chapter is locked
Register for a free Packt account to unlock a world of extra content!
A free Packt account unlocks extra newsletters, articles, discounted offers, and much more. Start advancing your knowledge today.
Unlock this book and the full library FREE for 7 days
Get unlimited access to 7000+ expert-authored eBooks and videos courses covering every tech area you can think of
Renews at $15.99/month. Cancel anytime
Visually different images