


barplot() offers the relationship between a categorical and a continuous variable. It uses rectangular bars with variable lengths:
# Import the required libraries
import pandas as pd
import seaborn as sns
import matplotlib.pyplot as plt

# Create DataFrame
df=pd.DataFrame({'x':['P','Q','R','S','T','U'],'y':[10,25,35,33,41,59]})

# Create lmplot
sns.barplot(x='x', y='y', data=df)

# Show figure
plt.show()
This results in the following output:
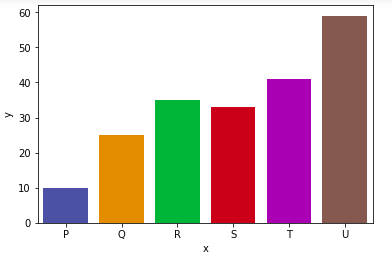
In the preceding example, the bar plot is created using the bar() function. It takes two columns – x and y – and a DataFrame as input. In the next section, we will see how to plot a distribution plot.


