
Using the Unity Profiler and Stats
Optimizing can be a lot of work, and there is a learning curve to get the hang of it. The good news is that it can be accomplished incrementally. Tackle the more obvious, bigger bang-for-the-buck things first. You can accomplish a lot with little or no visual degradation after a bit of experimentation.
The Unity Editor includes two built-in tools to assess performance: the Stats window and the Profiler window.
The Stats window
The Stats window shows real-time rendering statistics when you press Play in the Unity Editor. Reviewing and understanding these statistics is your first line in evaluating and improving the performance of your app, and can help you decide which optimization strategies, including those covered in this chapter, to tackle first.
In the Game window, enable Stats by pressing the Stats button. A screenshot is shown here:
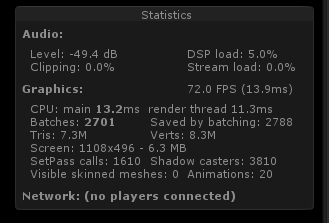
The actual statistics displayed will vary depending on your current build target (see http://docs.unity3d.com/Manual/RenderingStatistics...