
Enabling core debug logs
It can be highly useful to what's going on in Node's core. There's a very easy way to get this information.
In this recipe, we're going to use a special environment variable to enable various debugging flags that cause Node core debug logging mechanisms to print to STDOUT.
Getting ready
We're going to debug a small web server, so let's create that real quick.
On the command line, we execute the following commands:
$ mkdir app$ cd app$ npm init -y$ npm install --save express$ touch index.js
Our index.js file should contain the following:
const express = require('express')
const app = express()

app.get('/', (req, res) => res.send('hey'))

setTimeout(function myTimeout() {
   console.log('I waited for you.')
}, 100)

app.listen(3000)
Note
Web frameworksWe're only using Express here as an example. To learn more about Express and other frameworks see Chapter 7, Working with Web Frameworks.
How to do it...
We simply have to set the NODE_DEBUG environment variable to one or more of the supported flags.
Let's start with the timer flag by running our app like so:
$ NODE_DEBUG=timer node index.jsThis should show something like the following screenshot:

Core timer debug output
Let's try running the process again with both timer and http flags enabled:
$ NODE_DEBUG=timer,http node index.jsNow we need to trigger some HTTP operations to get any meaningful output, so let's send a request to the HTTP server using curl (or an alternative method, such as navigating to http://localhost:3000 in the browser):
$ curl http://localhost:3000This should give output similar to the following screenshot:

How it works...
The NODE_DEBUG environment variable can be set to any combination of the following flags:
httpnettlsstreammoduletimerclusterchild_processfs
Note
The fs debug flagThe quality of output varies for each flag. At the time of writing, the fs flag in particular doesn't actually supply any debug log output, but when enabled will cause a useful stack trace to be added to any unhandled error events for asynchronous I/O calls. See https://github.com/nodejs/node/blob/cccc6d8545c0ebd83f934b9734f5605aaeb000f2/lib/fs.js#L76-L94 for context.
In our recipe, we were able to enable core timer and HTTP debug logs, by setting the NODE_DEBUG environment variable to timers in the first and then timers,http in the second.
We used a comma to the debug flags; however, the delimiter can be any character.
Each line of output consists of the namespace, the process ID (PID), and the log message.
When we set NODE_DEBUG to timer, the first log indicates that it's creating a list for 100. Our code passes 100 as the second argument passed to setTimeout, internally the first argument (the timeout callback) is added to a queue of callbacks that should run after 100 ms. Next, we see a message, timeout callback 100, which means every 100 ms timeout callback will now be called. The following message (the now message) indicates the current time as the internal timers module sees it. This is milliseconds since the timers module was initialized. The now message can be useful to see the time drift between timeouts and intervals, because a timeout of 10 ms will rarely (if ever) be exactly 10 ms. It will be more like 14 ms, because of 4 ms of execution time for other code in a given tick (time around the event loop). While 4 ms drift is acceptable, a 20 ms drift would indicate potential performance problems-a simple NODE_DEBUG=timer prefix could be used for a quick check. The final debug message shows that the 100 list is now empty, meaning all callback functions set for that particular interval have now been called.
Most of the HTTP output is self-explanatory, we can see when a new connection has been made to the server, when a message has ended and when a socket has closed. The remaining two cryptic messages are write ret = true and SERVER socketOnParserExecute 78. The write ret = true relates to when the server attempted to write to a socket. If the value was false, it would mean the socket had closed and (again internally) the server would begin to handle that scenario. As for the socketOnParserExecute message, this has to do with Node's internal HTTP parser (written in C++). The number (78) is the string length of the headers sent from the client to the server.
Combining multiple flags can be useful. We set NODE_DEBUG to timer,http and we were able to see how the http module interacts with the internal timer module. We can see after the SERVER new http connection message; that two timers are set (based on the timeout lists being created), one for 12,0000 ms (two minutes, the default socket timeout) and one (in the example case) for 819 ms.
This second interval (819) is to do with an internal caching mechanism for the HTTP Date header. Since the smallest unit in the Date header is seconds, a timeout is set for the amount of milliseconds remaining before the next second, and the Date header is provided the same string for the remainder of that second.
Note
Core mechanicsFor a deeper understanding of our discussion here, see the There's more... section where we use debugging tools to step through code in Node core to show how to fully pick apart the log messages in this recipe.
There's more...
Let's look at the way Node Core triggers the debug log messages, and see if we can use this knowledge to gain a greater understanding of Node's internal workings.
Creating our own NODE_DEBUG flags
Core modules tend to use the util module's debuglog method to generate a logging that defaults to a no-op (an empty function) but writes log messages to STDOUT when the relevant flag appears in the NODE_DEBUG environment variable.
We can use util.debuglog to create our own core like log messages.
Let's take the app folder we created in the main recipe and copy it to instrumented-app:
$ cp -fr app instrumented-appNow let's make index.js look like this:
const util = require('util')
const express = require('express')
const debug = util.debuglog('my-app')
const app = express()

app.get('/', (req, res) => {
  debug('incoming request on /', req.route)
  res.send('hey')
})

setTimeout(function myTimeout() {
   debug('timeout complete')
   console.log('I waited for you.')
}, 100)

app.listen(3000)
Now we can turn on our custom debug logs like so:
$ NODE_DEBUG=my-app node index.jsIf we make a request to http://localhost:3000, the output of our process should look something like this:
MY-APP 30843: timeout complete
I waited for you.
MY-APP 30843: incoming request on / Route {
  path: '/',
  stack:
   [ Layer {
       handle: [Function],
       name: '<anonymous>',
       params: undefined,
       path: undefined,
       keys: [],
       regexp: /^\/?$/i,
       method: 'get' } ],
  methods: { get: true } }
Note
Prefer the debug moduleIn many cases, using the third-party debug module instead of util.debuglog is preferable. The debug modules supports wildcards, and the output is time stamped and color-coded, while the production cost of using it is negligible. See the Enabling debug logs recipe in this chapter for more.
Debugging Node core libraries
The core libraries that come bundled with the Node binary are in JavaScript, which means we can debug them the same way we debug our own code. This level of introspection means we can understand internal mechanics to a fine level of detail.
Let's use Devtools to pick apart how util.debuglog works.
Note
DevtoolsTo understand how to use Devtools, see the first recipe in this chapter, Debugging Node with Chrome Devtools.
We'll run our code we prepared in the Getting ready section like so (Node 8+):
$ NODE_DEBUG=timer node --inspect-brk index.jsOr if we're using Node 6.3.0+, use the following:
$ NODE_DEBUG=timer node --debug-brk --inspect index.jsNow if we navigate to chrome://inspect, click the inspect link this will open Devtools for our Node process. We should then see something like the following:
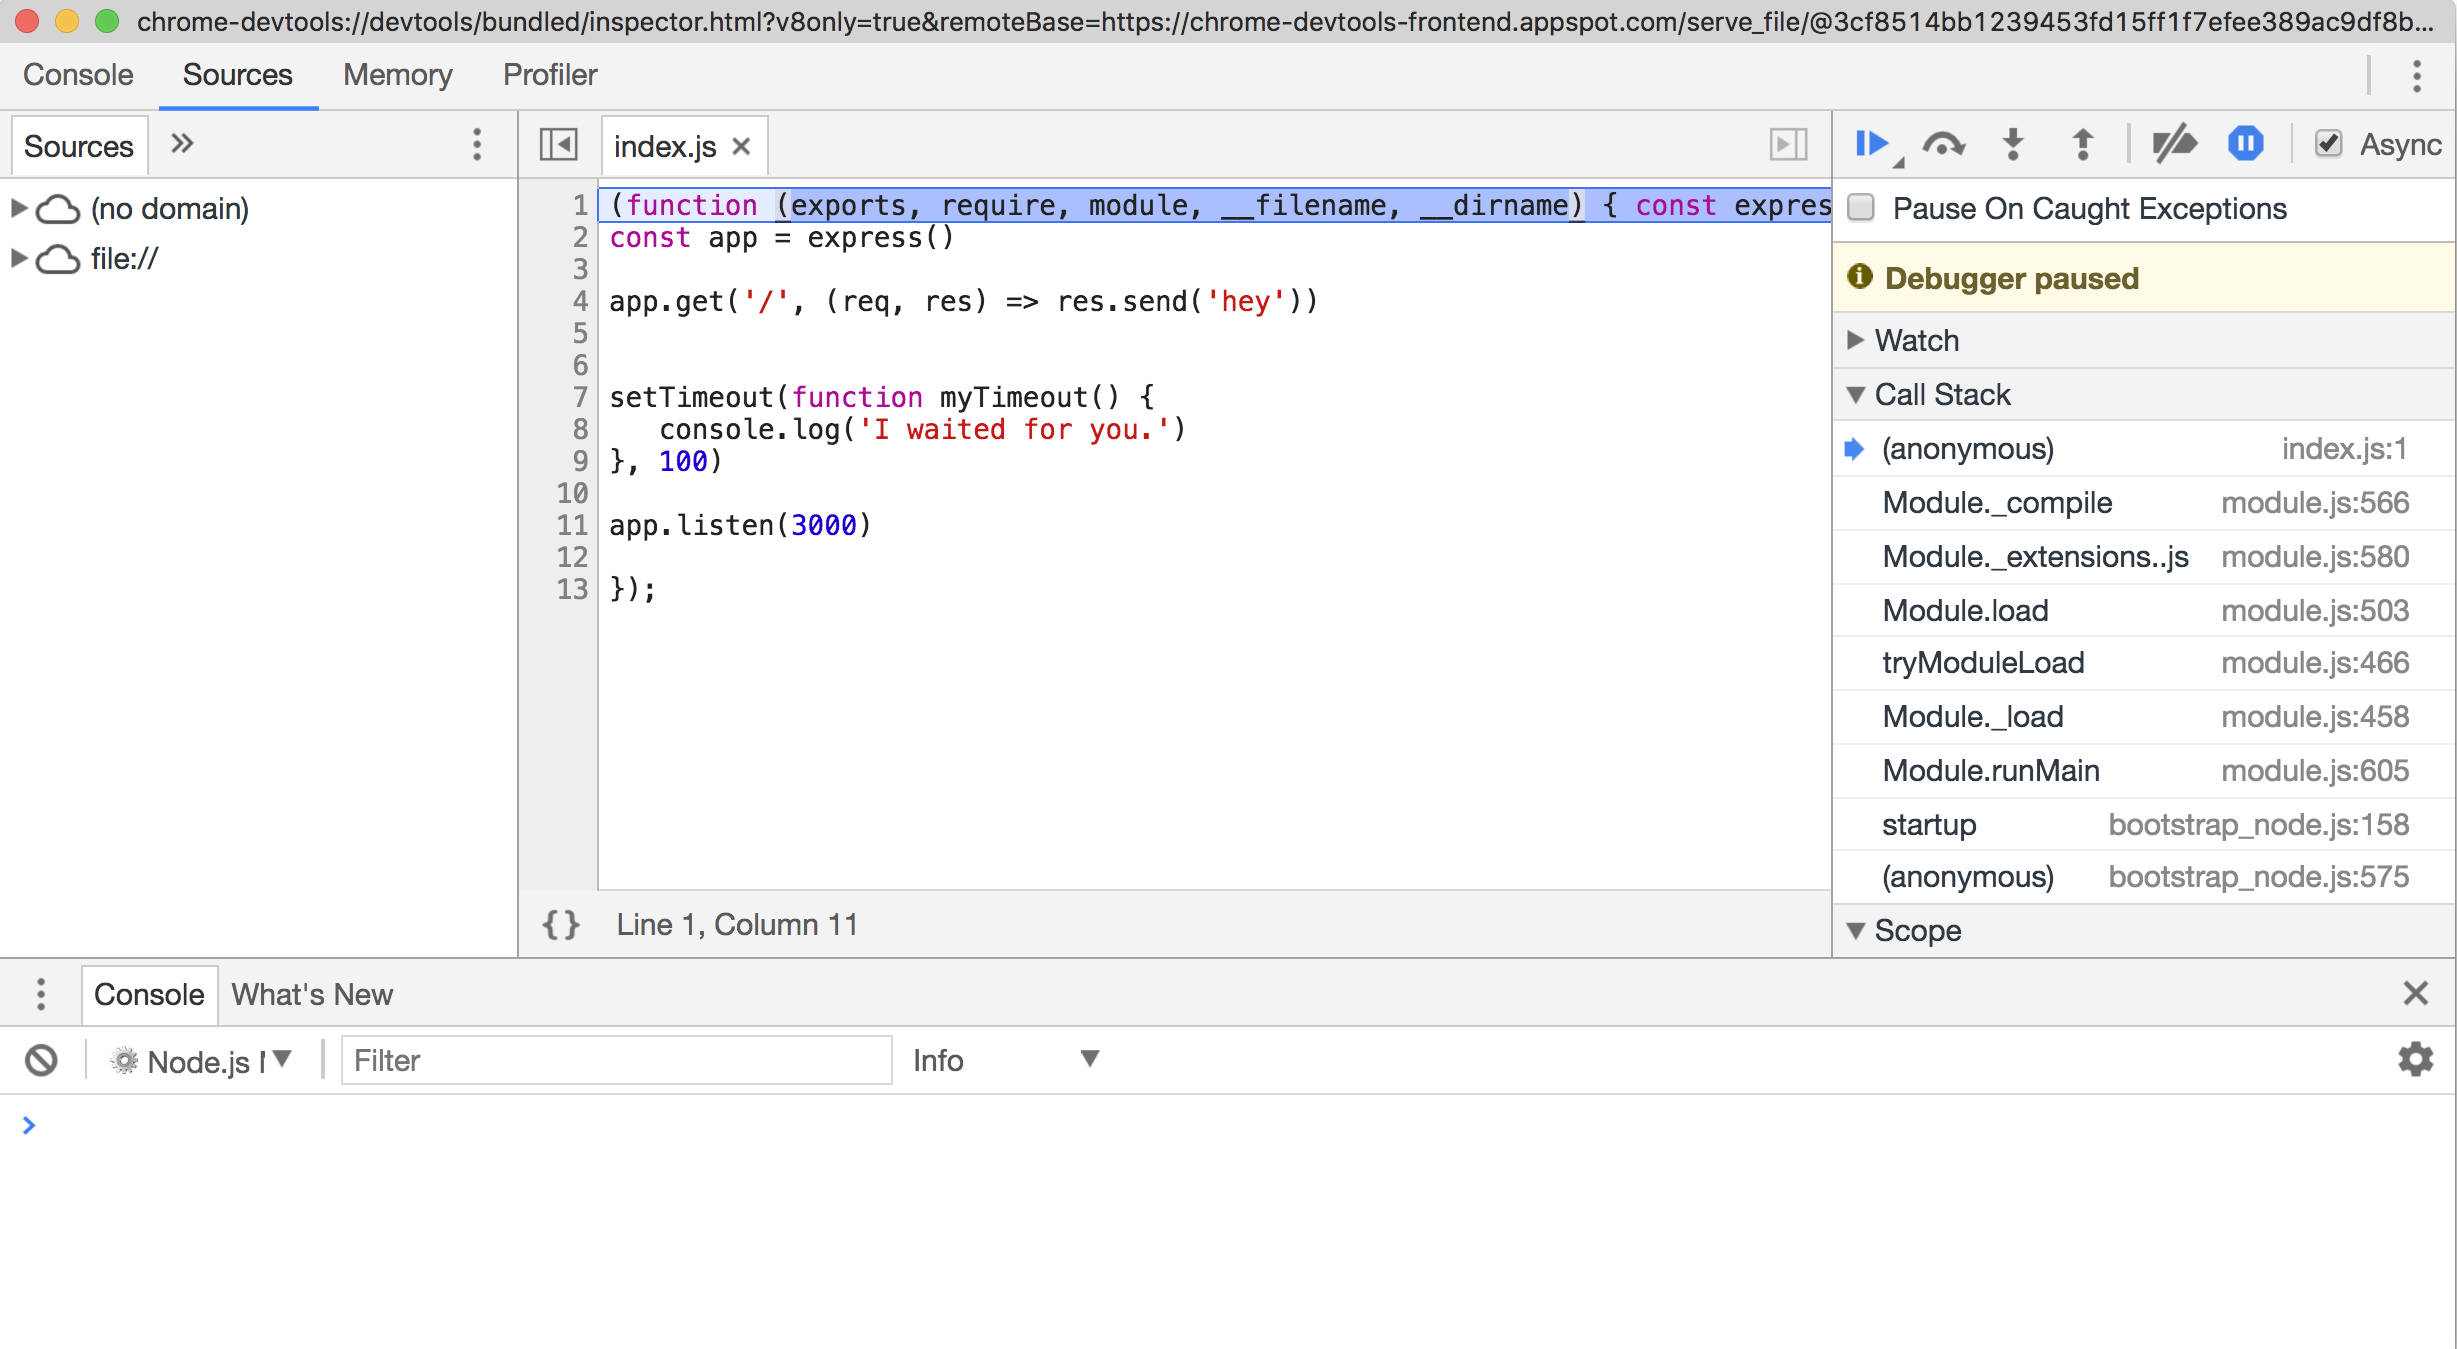
Now in left hand pane (the Navigation pane), we should see two drop-down trees (no domain) and file://. The (no domain) files are files that came compiled into Node.
Let's click the small right-facing triangle next to (no domain) to expand the list. Then locate the util.js file and double-click to open. At this point, we should see something like the following:

Next, we want to find the debuglog function. An easy way to do this is to press Cmd + F on macOS or Ctrl + F on Linux and Windows, to bring up the small find dialog, then type debuglog. This should highlight the exported debuglog method:

If we read the exported function, we should be able to ascertain that given the right conditions (for example, if the flag is set on NODE_DEBUG), a function is created and associated to a namespace. Different Node versions could have differences in their util.js. In our case, the first line of this generated function is line 157, so we set a breakpoint on line 157 (or wherever the first line of the generated function may be):

Now if we press run, our breakpoint should be triggered almost immediately. Let's hover over the arguments object referenced in the generated function:

We should see that the second argument passed to the generated debug function is 100 this relates to the millisecond parameter we pass to setTimeout in our index.js and is part of the first debug message (no 100 list was found...).
Now let's hit the blue play button four more times until it changes to a pause button and the top-right corner shows an error count of 4 as shown in the following screenshot:

Devtools perceives each log message as an error because the debug messages are written to STDERR. This is why the error count in the top-right corner is 4.
Now let's open a new browser tab and navigate to http://localhost:3000.
Devtools should have paused again at our breakpoint. If we hover over the arguments object in the generated function we should see that the second argument is 12000. This relates to the default 2 minute timeout on sockets (as discussed in the main recipe):

If we hit the play button again and inspect the arguments object, we should see the second argument is a number that's less than 1000:

Over on the right-hand side, in the Call Stack panel there's a frame called utcDate. Let's select frame to view the function:

This function is in a library that's only for internal core use called _http_outgoing.js.
We can see that it's currently within an if block that checks whether dateCache is falsey. If dateCache is falsey, it creates a new Date object and assigns the output of toUTCString to dateCache. Then it uses timers.enroll. This is a way of creating a setTimeout where the provided object represents the timeout reference. It sets the time to 1000 minus the millisecond unit in the date object that effectively measures how long there is left of the current second. Then it calls timers._unrefActive, which activates the timer without allowing the timer to keep the event loop open (which means the fact the queued timer operation won't keep the process alive). The utcDate._onTimeout method sets dateCache to undefined, so at the end of the timeout, dateCache is cleared.
If we look down the Call Stack panel, we should be able to infer that the utcDate function is called when a request is made, and is to do with HTTP header generation (specifically the Date HTTP header).
The net effect is that a process may receive, say, 10,000 requests a second, and only the first of those 10,000 has to perform the relatively expensive Date generation, while the following 9,999 requests all use the cached date.
And that's the sort of thing we can discover by debugging core.
See also
- Creating an Express web app, in Chapter 7, Working with Web Frameworks
- Working with files, in Chapter 3, Coordinating I/O
- Communicating over sockets, in Chapter 3, Coordinating I/O