Working with JavaFX charts
Making charts in JavaFX is easy:
- Create a list of data in a chart specific format
- Configure how you want your chart to look
Creating a Pie chart
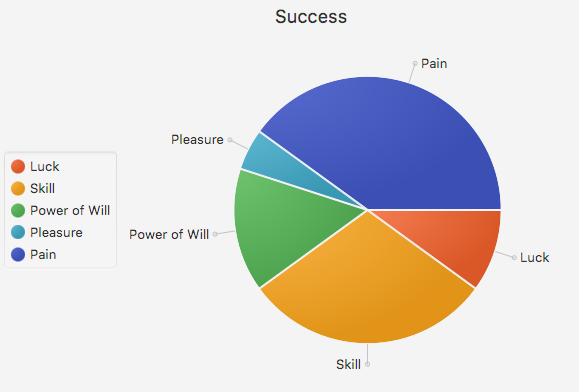
This chart shows only one dataset as the pie's slices. The bigger a corresponding value, the bigger its slice:
// chapter10/chart/PieChartDemo.java
ObservableList<PieChart.Data> pieChartData =
    FXCollections.observableArrayList(
                new PieChart.Data("Luck", 10),
                new PieChart.Data("Skill", 30),
                new PieChart.Data("Power of Will", 15),
                new PieChart.Data("Pleasure", 5),
                new PieChart.Data("Pain", 40));
The JavaFX PieChart for this looks as follows:
Note
Note that numbers in PieChart.Data are not always percents—the total sum is calculated on each new element and each number represents a share of this total sum.
Additionally, all you need to create PieChart is to choose the title and legend options:
PieChart chart = new PieChart(data);
chart.setTitle...