
Enabling debug logs
More than 13,450 modules directly depend on the third-debug module (at the time of writing). Many other modules indirectly use the debug module by the use of those 13,450. Some highly notable libraries, such as Express, Koa, and Socket.io, also use the debug module.
In many code bases, there's a wealth of often untapped tracing and debugging logs that we can use to infer and understand how our application is behaving.
In this recipe, we'll discover how to enable and effectively analyze these log messages.
Getting ready
Let's create a small Express app which we'll be debugging.
On the command line, we execute the following commands:
$ mkdir app$ cd app$ npm init -y$ npm install --save express$ touch index.js
Our index.js file should contain the following:
const express = require('express')
const app = express()
const stylus = require('stylus')

app.get('/some.css', (req, res) => {
  const css = stylus(`
    body
      color:black
  `).render()
  res.send(css)
})

app.listen(3000)
Note
Web frameworksWe're only using Express here as an example, to learn more about Express and other frameworks see Chapter 7, Working With Web Frameworks.
How to do it...
Let's turn on all logging:
DEBUG=* node index.jsAs soon as we start the server, we see some debug output that should be something like the following screenshot:
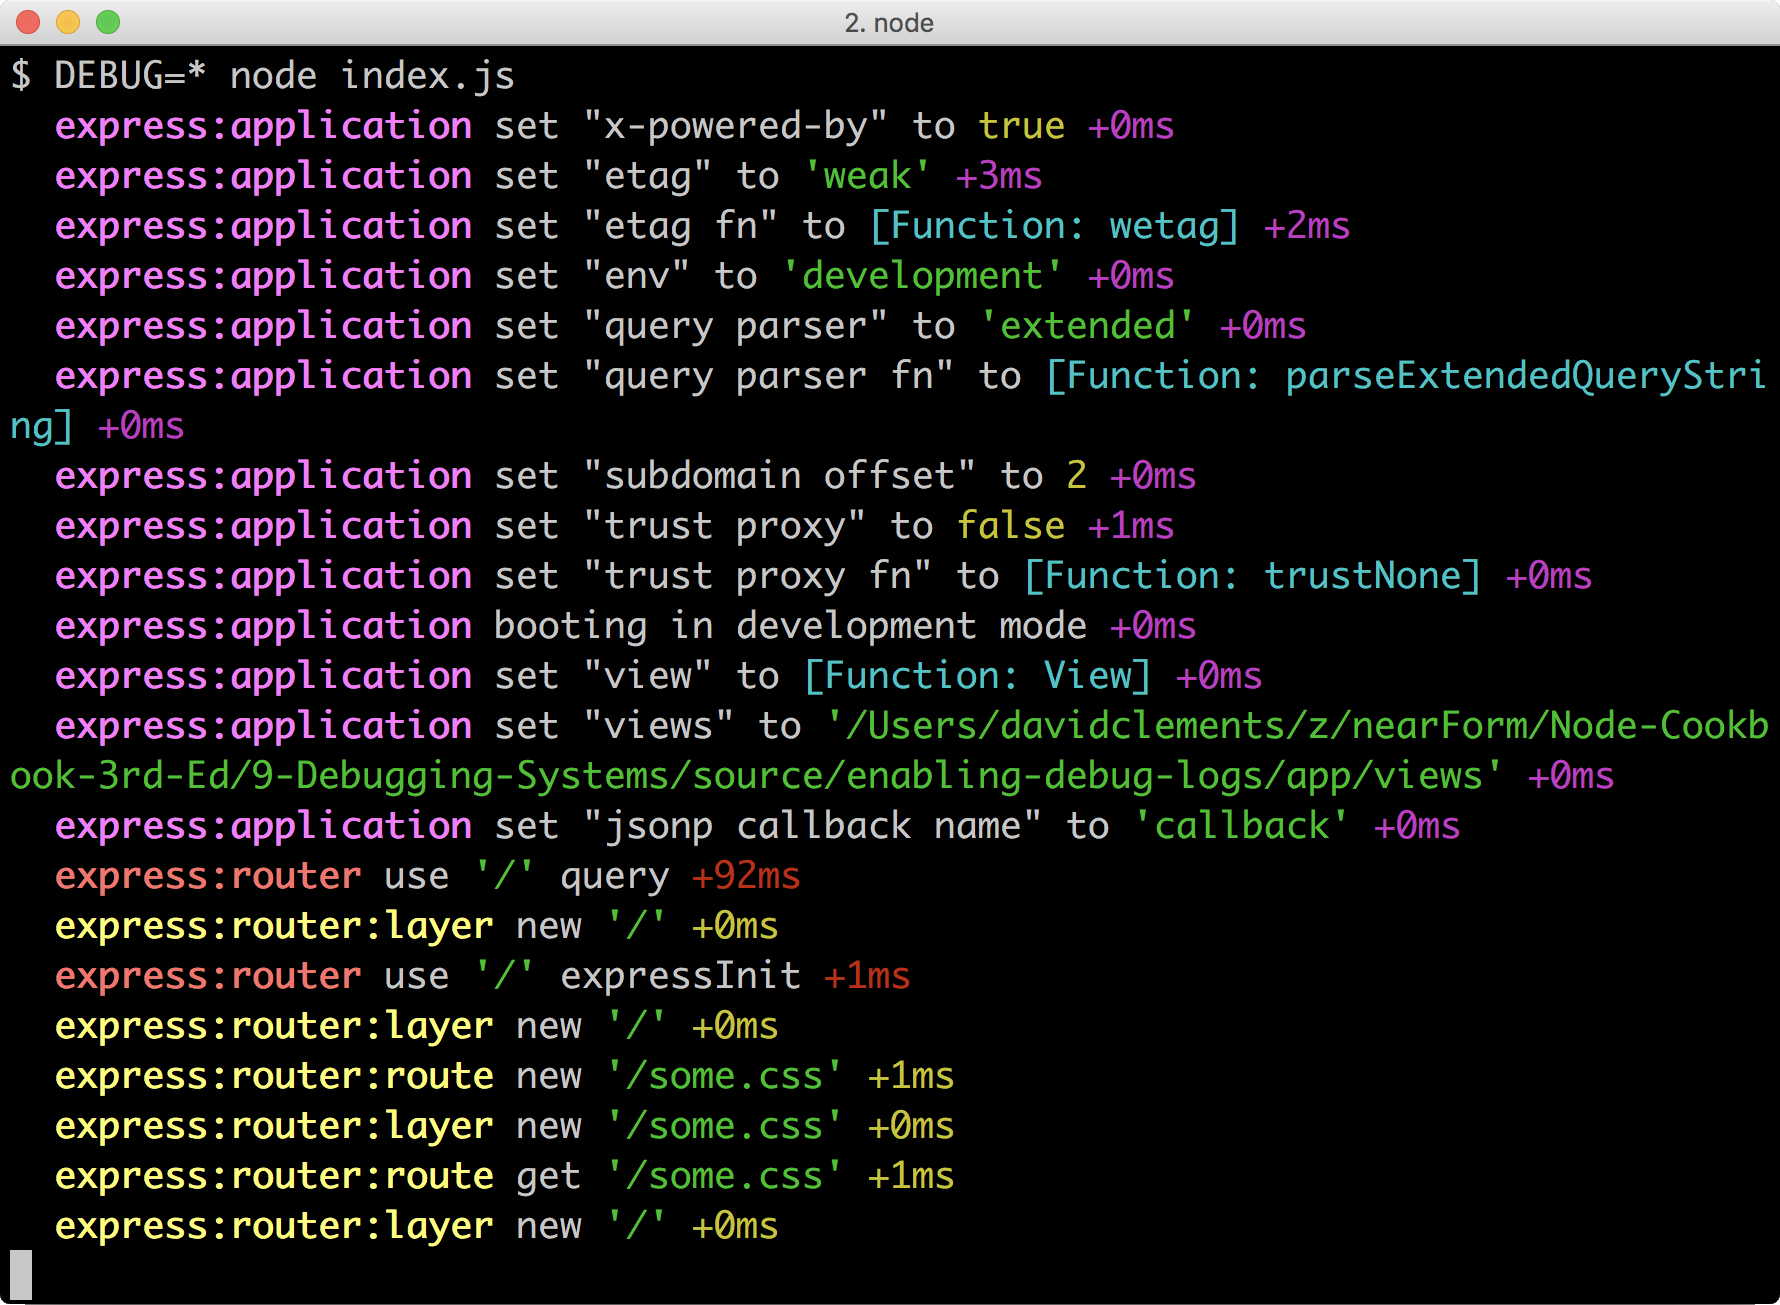
The first message is as follows:
express:application set "x-powered-by" to true +0msLet's make a mental note to add app.disable('x-powered-by') since it's much better for security to not publicly announce the software a server is using.
Note
SecurityFor more on security and server hardening, see Chapter 8, Dealing with Security.
This debug log line has helped us to understand how our chosen framework actually behaves, and allows us to mitigate any undesired behaviour in an informed manner.
Now let's make a request to the server. If we have curl installed we can do the following:
$ curl http://localhost:3000/some.css(Or otherwise, we can simply use a browser to access the same route).
This results in more debug output, mostly a very large amount of stylus debug logs:

While it's interesting to see the Stylus parser at work, it's a little overwhelming. Let's try just looking only at express log output:
$ DEBUG=express:* node index.jsAnd we'll make a request again (we can use curl or a browser as appropriate):
$ curl http://localhost:3000/some.css
This time our log filtering enabled us to easily see the debug messages for an incoming request.
How it works...
In our recipe, we initially set DEBUG to *, which means enable all logs. Then we wanted to zoom in explicitly on express related log messages. So we set DEBUG to express:*, which means enable all logs that begin with express:. By convention, modules and frameworks delimit sub-namespaces with a : (colon).
At an internal level, the debug module reads from the process.env.DEBUG, splits the string by whitespace or commas, and then converts each item into a regular expression.
When a module uses the debug module, it will require debug and call it with a namespace representing that module to create a logging function that it then uses to output messages when debug logs are enabled for that namespace.
Note
Using the debug moduleFor more on using the debug module in our own code, see Instrumenting code with debug in the There's more... section.
Each time a module registers itself with the debug module the list of regular expressions (as generated from the DEBUG environment variable) are tested against the namespace provided by the registering module.
If there's no match the resulting logger function is a no-op (that is, an empty function). So the cost of the logs in production is minimal.
If there is a match, the returned logging function will accept input, decorate it with ANSI codes (for terminal coloring), and create a time stamp on each call to the logger.
There's more...
Let's find out how to use debug in our own code, and some practices around enabling debug logs in production scenarios.
Instrumenting code with debug
We can use the debug module in our own code to create that relate to the context of our application or module.
Let's copy our app folder from the main recipe, call it instrumented-app, and install the debug module:
$ cp -fr app instrumented-app$ cd instrumented-app$ npm install --save debug
Next, we'll make index.js look like so:
const express = require('express')
const app = express()
const stylus = require('stylus')
const debug = require('debug')('my-app')

app.get('/some.css', (req, res) => {
  debug('css requested')
  const css = stylus(`
    body
      color:black
  `).render()
  res.send(css)
})

app.listen(3000)
We've required debug, created a logging function (called debug) with the my-app namespace and then used it in our route handler.
Now let's start our app and just turn on logs for the my-app namespace:
$ DEBUG=my-app node index.jsNow let's make a request to http://localhost:3000/some.css, either in the browser, or with curl we could do the following:
$ curl http://localhost:3000/some.cssThis should create the following log message:
my-app css requested +0msUsing debug in production
The default debug logs are not suited to logging. The logging output is human-readable rather than machine-readable output; it uses colors that are enabled with terminal ANSI codes (which will essentially pollute the output when saved to file or database).
In production, if we want to turn on debug logs we can produce more standard logging output with the following:
$ DEBUG_COLORS=no DEBUG=* node index.jsJSON logging with pino-debug
The pino-debug module passes debug messages through pino so that output is in newline-delimited JSON (a common logging format which offers a good compromise between machine and human readability).
Note
About pinopino is a high performance logger, that's up to 8-9 times faster than other popular loggers (see the benchmarks at: https://github.com/pinojs/pino#benchmarks for more information). For more information about pino visit https://www.npmjs.com/package/pino.
Due to the performant techniques used by pino, using pino-debug leads to a performance increase in log writing (and therefore leaves more room for other in-process activities such as serving requests) even though there's more output per log message!
Let's copy our app folder to logging-app and install pino-debug:
$ cp -fr app logging-app$ npm install --save pino-debug
We'll add two npm scripts, one for development and one for production. Let's edit package.json like so:
{
  "name": "app",
  "version": "1.0.0",
  "description": "",
  "main": "index.js",
  "scripts": {
    "test": "echo \"Error: no test specified\" && exit 1",
    "dev": "node index.js",
    "prod": "node -r pino-debug index.js"
  },
  "keywords": [],
  "author": "",
  "license": "ISC",
  "dependencies": {
    "express": "^4.15.0",
    "pino-debug": "^1.0.3",
    "stylus": "^0.54.5"
  }
}
Now we run the following:
$ DEBUG=* npm run --silent prodWe should see the express logs in JSON form, where the msg field contains the log contents and the ns field contains the relevant debug message. Additionally, pino adds a few other useful fields, such as time, pid, hostname, level (the log level defaults to 20, which is debug level), and v (the log format version):

Note
Debug namespace to log level mappingSee the pino-debug readme at http://npm.im/pino-debug for mapping namespaces to custom log levels.
See also
- Creating an Express web app, in Chapter 3, Coordinating I/O
- Interfacing with standard I/O, in Chapter 3, Coordinating I/O
- Adding logging, in Chapter 7, Working with Web Frameworks