Plotting in Pandas
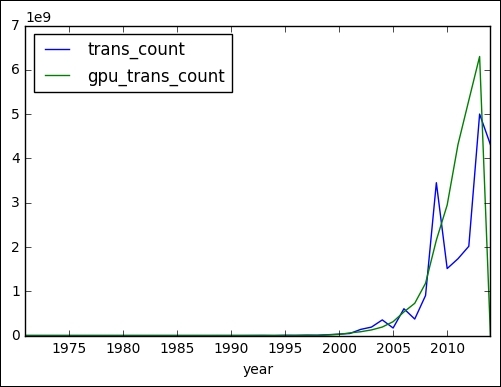
The plot() method in the Pandas Series and DataFrame classes wraps around the related matplotlib functions. In its most basic form, without any arguments, the plot() method displays the following plot for the dataset we have been using throughout this chapter:
To create a semi-log plot, add the logy parameter:
df.plot(logy=True)
This results in the following plot for our data:

To create a scatter plot, specify the kind parameter to be scatter. We also need to specify two columns. Set the loglog parameter to True to produce a log-log graph (we need at least Pandas v0.13.0 for this code):
df[df['gpu_trans_count'] > 0].plot(kind='scatter', x='trans_count', y='gpu_trans_count', loglog=True)
Refer to the following plot for the end result:

The following program is in the ch-06.ipynb file in this book's code bundle:
import matplotlib.pyplot as plt
import numpy as np
import pandas as pd

df = pd.read_csv('transcount.csv')
df = df.groupby...