Using k-means to cluster data
In a dataset, we observe sets of points gathered together. With k-means, we will categorize all the points into groups, or clusters.
Getting ready
First, let's walk through some simple clustering; then we'll talk about how k-means works:
import numpy as np
import pandas as pd

from sklearn.datasets import make_blobs
blobs, classes = make_blobs(500, centers=3)
Also, since we'll be doing some plotting, import matplotlib as shown:
import matplotlib.pyplot as plt
%matplotlib inline  #Within an ipython notebook
How to do it…
We are going to walk through a simple example that clusters blobs of fake data. Then we'll talk a little bit about how k-means works to find the optimal number of blobs:
- Looking at our blobs, we can see that there are three distinct clusters:
f, ax = plt.subplots(figsize=(7.5, 7.5))
rgb = np.array(['r', 'g', 'b'])
ax.scatter(blobs[:, 0], blobs[:, 1], color=rgb[classes])
ax.set_title("Blobs")
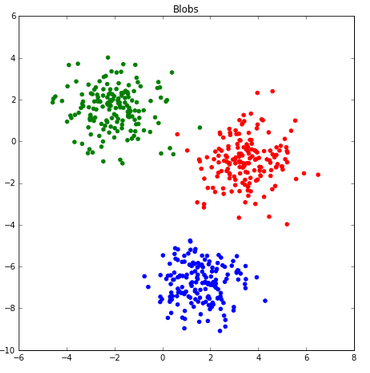
Now we can use k-means to find the centers of these clusters...