Search icon CANCEL
Subscription
0
Cart icon
Your Cart (0 item)
Close icon
You have no products in your basket yet
Save more on your purchases! discount-offer-chevron-icon
Savings automatically calculated. No voucher code required.
Arrow left icon
All Products
Best Sellers
New Releases
Books
Videos
Audiobooks
Learning Hub
Newsletter Hub
Free Learning
Arrow right icon
timer SALE ENDS IN
0 Days
:
00 Hours
:
00 Minutes
:
00 Seconds
Data Science  with Python

Data Science with Python: Combine Python with machine learning principles to discover hidden patterns in raw data

Arrow left icon
Profile Icon Rohan Chopra Profile Icon England Profile Icon Mohamed Noordeen Alaudeen
Arrow right icon
€23.99
Full star icon Full star icon Full star icon Empty star icon Empty star icon 3 (1 Ratings)
eBook Jul 2019 426 pages 1st Edition
eBook
€23.99
Paperback
€29.99
Subscription
Free Trial
Renews at €11.99p/m
eBook
€23.99
Paperback
€29.99
Subscription
Free Trial
Renews at €11.99p/m

What do you get with eBook?

Product feature icon Instant access to your Digital eBook purchase
Product feature icon Download this book in EPUB and PDF formats
Product feature icon Access this title in our online reader with advanced features
Product feature icon DRM FREE - Read whenever, wherever and however you want
Product feature icon AI Assistant (beta) to help accelerate your learning
OR
Modal Close icon
Payment Processing...
tick Completed

Billing Address

Table of content icon View table of contents Preview book icon Preview Book

Data Science with Python

Introduction to Data Science and Data Pre-Processing

Learning Objectives

By the end of this chapter, you will be able to:

  • Use various Python machine learning libraries
  • Handle missing data and deal with outliers
  • Perform data integration to bring together data from different sources
  • Perform data transformation to convert data into a machine-readable form
  • Scale data to avoid problems with values of different magnitudes
  • Split data into train and test datasets
  • Describe the different types of machine learning
  • Describe the different performance measures of a machine learning model

This chapter introduces data science and covers the various processes included in the building of machine learning models, with a particular focus on pre-processing.

Introduction

We live in a world where we are constantly surrounded by data. As such, being able to understand and process data is an absolute necessity.

Data Science is a field that deals with the description, analysis, and prediction of data. Consider an example from our daily lives: every day, we utilize multiple social media applications on our phones. These applications gather and process data in order to create a more personalized experience for each user – for example, showing us news articles that we may be interested in, or tailoring search results according to our location. This branch of data science is known as machine learning.

Machine learning is the methodical learning of procedures and statistical representations that computers use to accomplish tasks without human intervention. In other words, it is the process of teaching a computer to perform tasks by itself without explicit instructions, relying only on patterns and inferences. Some common uses of machine...

Python Libraries

Throughout this book, we'll be using various Python libraries, including pandas, Matplotlib, Seaborn, and scikit-learn.

pandas

pandas is an open source package that has many functions for loading and processing data in order to prepare it for machine learning tasks. It also has tools that can be used to analyze and manipulate data. Data can be read from many formats using pandas. We will mainly be using CSV data throughout this book. To read CSV data, you can use the read_csv() function by passing filename.csv as an argument. An example of this is shown here:

>>> import pandas as pd
>>> pd.read_csv("data.csv")

In the preceding code, pd is an alias name given to pandas. It is not mandatory to give an alias. To visualize a pandas DataFrame, you can use the head() function to list the top five rows. This will be demonstrated in one of the following exercises.

Note

Please visit the following link to learn more about pandas...

Roadmap for Building Machine Learning Models

The roadmap for building machine learning models is straightforward and consists of five major steps, which are explained here:

  • Data Pre-processing

    This is the first step in building a machine learning model. Data pre-processing refers to the transformation of data before feeding it into the model. It deals with the techniques that are used to convert unusable raw data into clean reliable data.

    Since data collection is often not performed in a controlled manner, raw data often contains outliers (for example, age = 120), nonsensical data combinations (for example, model: bicycle, type: 4-wheeler), missing values, scale problems, and so on. Because of this, raw data cannot be fed into a machine learning model because it might compromise the quality of the results. As such, this is the most important step in the process of data science.

  • Model Learning

    After pre-processing the data and splitting it into train/test sets (more on this...

Data Representation

The main objective of machine learning is to build models that understand data and find underlying patterns. In order to do so, it is very important to feed the data in a way that is interpretable by the computer. To feed the data into a model, it must be represented as a table or a matrix of the required dimensions. Converting your data into the correct tabular form is one of the first steps before pre-processing can properly begin.

Data Represented in a Table

Data should be arranged in a two-dimensional space made up of rows and columns. This type of data structure makes it easy to understand the data and pinpoint any problems. An example of some raw data stored as a CSV (comma separated values) file is shown here:

Figure 1.1: Raw data in CSV format

The representation of the same data in a table is as follows:

Figure 1.2: CSV data in table format

If you compare the data in CSV and table formats...

Data Cleaning

Data cleaning includes processes such as filling in missing values and handling inconsistencies. It detects corrupt data and replaces or modifies it.

Missing Values

The concept of missing values is important to understand if you want to master the skill of successful management and understanding of data. Let's take a look at the following figure:

Figure 1.14: Bank customer credit data

As you can see, the data belongs to a bank; each row is a separate customer and each column contains their details, such as age and credit amount. There are some cells that have either NA or are just empty. This is missing data. Each piece of information about the customer is crucial for the bank. If any of the information is missing, then it will be difficult for the bank to predict the risk of providing a loan to the customer.

Handling Missing Data

Intelligent handling of missing data will result in building a robust model capable of handling...

Data Integration

So far, we've made sure to remove the impurities in data and make it clean. Now, the next step is to combine data from different sources to get a unified structure with more meaningful and valuable information. This is mostly used if the data is segregated into different sources. To make it simple, let's assume we have data in CSV format in different places, all talking about the same scenario. Say we have some data about an employee in a database. We can't expect all the data about the employee to reside in the same table. It's possible that the employee's personal data will be located in one table, the employee's project history will be in a second table, the employee's time-in and time-out details will be in another table, and so on. So, if we want to do some analysis about the employee, we need to get all the employee data in one common place. This process of bringing data together in one place is called data integration. To do...

Data Transformation

Previously, we saw how we can combine data from different sources into a unified dataframe. Now, we have a lot of columns that have different types of data. Our goal is to transform the data into a machine-learning-digestible format. All machine learning algorithms are based on mathematics. So, we need to convert all the columns into numerical format. Before that, let's see all the different types of data we have.

Taking a broader perspective, data is classified into numerical and categorical data:

  • Numerical: As the name suggests, this is numeric data that is quantifiable.
  • Categorical: The data is a string or non-numeric data that is qualitative in nature.

Numerical data is further divided into the following:

  • Discrete: To explain in simple terms, any numerical data that is countable is called discrete, for example, the number of people in a family or the number of students in a class. Discrete data can only take certain values...

Data in Different Scales

In real life, values in a dataset might have a variety of different magnitudes, ranges, or scales. Algorithms that use distance as a parameter may not weigh all these in the same way. There are various data transformation techniques that are used to transform the features of our data so that they use the same scale, magnitude, or range. This ensures that each feature has an appropriate effect on a model's predictions.

Some features in our data might have high-magnitude values (for example, annual salary), while others might have relatively low values (for example, the number of years worked at a company). Just because some data has smaller values does not mean it is less significant. So, to make sure our prediction does not vary because of different magnitudes of features in our data, we can perform feature scaling, standardization, or normalization (these are three similar ways of dealing with magnitude issues in data).

Exercise 9: Implementing...

Data Discretization

So far, we have done the categorical data treatment using encoding and numerical data treatment using scaling.

Data discretization is the process of converting continuous data into discrete buckets by grouping it. Discretization is also known for easy maintainability of the data. Training a model with discrete data becomes faster and more effective than when attempting the same with continuous data. Although continuous-valued data contains more information, huge amounts of data can slow the model down. Here, discretization can help us strike a balance between both. Some famous methods of data discretization are binning and using a histogram. Although data discretization is useful, we need to effectively pick the range of each bucket, which is a challenge. 

The main challenge in discretization is to choose the number of intervals or bins and how to decide on their width.

Here we make use of a function called pandas.cut(). This function is useful to...

Train and Test Data

Once you've pre-processed your data into a format that's ready to be used by your model, you need to split up your data into train and test sets. This is because your machine learning algorithm will use the data in the training set to learn what it needs to know. It will then make a prediction about the data in the test set, using what it has learned. You can then compare this prediction against the actual target variables in the test set in order to see how accurate your model is. The exercise in the next section will give more clarity on this.

We will do the train/test split in proportions. The larger portion of the data split will be the train set and the smaller portion will be the test set. This will help to ensure that you are using enough data to accurately train your model.

In general, we carry out the train-test split with an 80:20 ratio, as per the Pareto principle. The Pareto principle states that "for many events, roughly 80% of...

Supervised Learning

Supervised learning is a learning system that trains using labeled data (data in which the target variables are already known). The model learns how patterns in the feature matrix map to the target variables. When the trained machine is fed with a new dataset, it can use what it has learned to predict the target variables. This can also be called predictive modeling.

Supervised learning is broadly split into two categories. These categories are as follows:

Classification mainly deals with categorical target variables. A classification algorithm helps to predict which group or class a data point belongs to.

When the prediction is between two classes, it is known as binary classification. An example is predicting whether or not a customer will buy a product (in this case, the classes are yes and no).

If the prediction involves more than two target classes, it is known as multi-classification; for example, predicting all the items that a customer...

Unsupervised Learning

Unlike supervised learning, the unsupervised learning process involves data that is neither classified nor labeled. The algorithm will perform analysis on the data without guidance. The job of the machine is to group unclustered information according to similarities in the data. The aim is for the model to spot patterns in the data in order to give some insight into what the data is telling us and to make predictions.

An example is taking a whole load of unlabeled customer data and using it to find patterns to cluster customers into different groups. Different products could then be marketed to the different groups for maximum profitability.

Unsupervised learning is broadly categorized into two types:

  • Clustering: A clustering procedure helps to discover the inherent patterns in the data.
  • Association: An association rule is a unique way to find patterns associated with a large amount of data, such as the supposition that when someone buys product...

Reinforcement Learning

Reinforcement learning is a broad area in machine learning where the machine learns to perform the next step in an environment by looking at the results of actions already performed. Reinforcement learning does not have an answer, and the learning agent decides what should be done to perform the specified task. It learns from its prior knowledge. This kind of learning involves both a reward and a penalty.

No matter the type of machine learning you're using, you'll want to be able to measure how effective your model is. You can do this using various performance metrics. You will see how these are used in later chapters in the book, but a brief overview of some of the most common ones is given here.

Performance Metrics

There are different evaluation metrics in machine learning, and these depend on the type of data and the requirements. Some of the metrics are as follows:

  • Confusion matrix
  • Precision
  • Recall
  • Accuracy
  • F1 score

Confusion Matrix

A confusion matrix is a table that is used to define the performance of the classification model on the test data for which the actual values are known. To understand this better, look at the following figure, showing predicted and actual values:

Figure 1.54: Predicted versus actual values

Let's examine the concept of a confusion matrix and its metrics, TP, TN, FP, and FN, in detail. Assume you are building a model that predicts pregnancy:

  • TP (True Positive): The sex is female and she is actually pregnant, and your model also predicted True.
  • FP (False Positive): The sex is male and your model predicted True, which cannot happen. This is a type of error called a...

Summary

In this chapter, we covered the basics of data science and explored the process of extracting underlying information from data using scientific methods, processes, and algorithms. We then moved on to data pre-processing, which includes data cleaning, data integration, data transformation, and data discretization.

We saw how pre-processed data is split into train and test sets when building a model using a machine learning algorithm. We also covered supervised, unsupervised, and reinforcement learning algorithms.

Lastly, we went over the different metrics, including confusion matrices, precision, recall, and accuracy.

In the next chapter, we will cover data visualization.

Left arrow icon Right arrow icon
Download code icon Download Code

Key benefits

  • Gain useful insights into data science, from data collection through to visualization
  • Get up to speed with pandas, scikit-learn, and Matplotlib
  • Study a variety of data science algorithms using real-world datasets

Description

Data Science with Python begins by introducing you to data science and teaches you to install the packages you need to create a data science coding environment. You will learn three major techniques in machine learning: unsupervised learning, supervised learning, and reinforcement learning. You will also explore basic classification and regression techniques, such as support vector machines, decision trees, and logistic regression. As you make your way through the book, you will understand the basic functions, data structures, and syntax of the Python language that are used to handle large datasets with ease. You will learn about NumPy and pandas libraries for matrix calculations and data manipulation, discover how to use Matplotlib to create highly customizable visualizations, and apply the boosting algorithm XGBoost to make predictions. In the concluding chapters, you will explore convolutional neural networks (CNNs), deep learning algorithms used to predict what is in an image. You will also understand how to feed human sentences to a neural network, make the model process contextual information, and create human language processing systems to predict the outcome. By the end of this book, you will be able to understand and implement any new data science algorithm and have the confidence to experiment with tools or libraries other than those covered in the book.

Who is this book for?

Data Science with Python is designed for data analysts, data scientists, database engineers, and business analysts who want to move towards using Python and machine learning techniques to analyze data and predict outcomes. Basic knowledge of Python and data analytics will prove beneficial to understand the various concepts explained through this book.

What you will learn

  • Pre-process data to make it ready to use for machine learning
  • Create data visualizations with Matplotlib
  • Use scikit-learn to perform dimension reduction using principal component analysis (PCA)
  • Solve classification and regression problems
  • Get predictions using the XGBoost library
  • Process images and create machine learning models to decode them
  • Process human language for prediction and classification
  • Use TensorBoard to monitor training metrics in real time
  • Find the best hyperparameters for your model with AutoML

Product Details

Country selected
Publication date, Length, Edition, Language, ISBN-13
Publication date : Jul 19, 2019
Length: 426 pages
Edition : 1st
Language : English
ISBN-13 : 9781838552169
Category :
Languages :
Concepts :

What do you get with eBook?

Product feature icon Instant access to your Digital eBook purchase
Product feature icon Download this book in EPUB and PDF formats
Product feature icon Access this title in our online reader with advanced features
Product feature icon DRM FREE - Read whenever, wherever and however you want
Product feature icon AI Assistant (beta) to help accelerate your learning
OR
Modal Close icon
Payment Processing...
tick Completed

Billing Address

Product Details

Publication date : Jul 19, 2019
Length: 426 pages
Edition : 1st
Language : English
ISBN-13 : 9781838552169
Category :
Languages :
Concepts :

Packt Subscriptions

See our plans and pricing
Modal Close icon
€11.99 billed monthly
Feature tick icon Unlimited access to Packt's library of 6,500+ practical books and videos
Feature tick icon Constantly refreshed with 50+ new titles a month
Feature tick icon Exclusive Early access to books as they're written
Feature tick icon Solve problems while you work with advanced search and reference features
Feature tick icon Offline reading on the mobile app
Feature tick icon Simple pricing, no contract
€119.99 billed annually
Feature tick icon Unlimited access to Packt's library of 6,500+ practical books and videos
Feature tick icon Constantly refreshed with 50+ new titles a month
Feature tick icon Exclusive Early access to books as they're written
Feature tick icon Solve problems while you work with advanced search and reference features
Feature tick icon Offline reading on the mobile app
Feature tick icon Choose a DRM-free eBook or Video every month to keep
Feature tick icon PLUS own as many other DRM-free eBooks or Videos as you like for just €5 each
Feature tick icon Exclusive print discounts
€169.99 billed in 18 months
Feature tick icon Unlimited access to Packt's library of 6,500+ practical books and videos
Feature tick icon Constantly refreshed with 50+ new titles a month
Feature tick icon Exclusive Early access to books as they're written
Feature tick icon Solve problems while you work with advanced search and reference features
Feature tick icon Offline reading on the mobile app
Feature tick icon Choose a DRM-free eBook or Video every month to keep
Feature tick icon PLUS own as many other DRM-free eBooks or Videos as you like for just €5 each
Feature tick icon Exclusive print discounts

Frequently bought together


Stars icon
Total 100.97
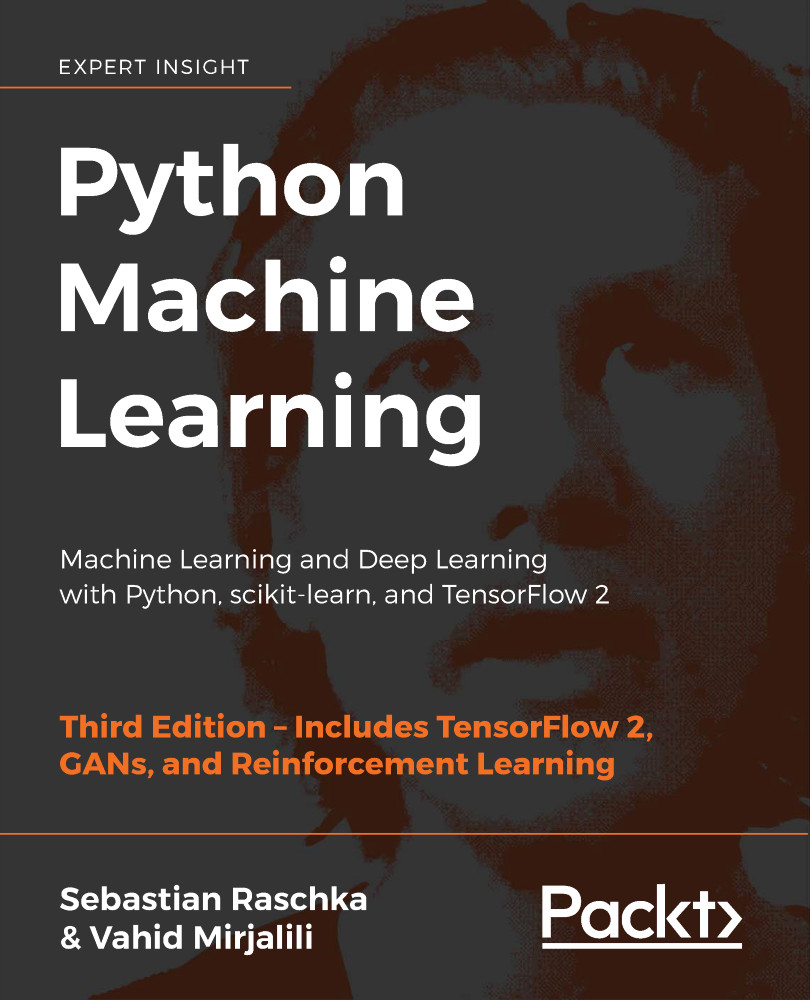
Data Science  with Python
€29.99
Python Machine Learning
€41.99
Data Science Projects with Python
€28.99
Total 100.97 Stars icon
Visually different images

Table of Contents

16 Chapters
Chapter 1 Chevron down icon Chevron up icon
Introduction to Data Science and Data Pre-Processing Chevron down icon Chevron up icon
Chapter 2 Chevron down icon Chevron up icon
Data Visualization Chevron down icon Chevron up icon
Chapter 3 Chevron down icon Chevron up icon
Introduction to Machine Learning via Scikit-Learn Chevron down icon Chevron up icon
Chapter 4 Chevron down icon Chevron up icon
Dimensionality Reduction and Unsupervised Learning Chevron down icon Chevron up icon
Chapter 5 Chevron down icon Chevron up icon
Mastering Structured Data Chevron down icon Chevron up icon
Chapter 6 Chevron down icon Chevron up icon
Decoding Images Chevron down icon Chevron up icon
Chapter 7 Chevron down icon Chevron up icon
Processing Human Language Chevron down icon Chevron up icon
Chapter 8 Chevron down icon Chevron up icon
Tips and Tricks of the Trade Chevron down icon Chevron up icon

Customer reviews

Rating distribution
Full star icon Full star icon Full star icon Empty star icon Empty star icon 3
(1 Ratings)
5 star 0%
4 star 0%
3 star 100%
2 star 0%
1 star 0%
C.T. Wong Apr 11, 2021
Full star icon Full star icon Full star icon Empty star icon Empty star icon 3
For a novice at data science, I found most of what I needed to get started in this book but if you are not a fan of constantly having to refer to another section in the middle of the chapter there are probably other books with better layouts. Personally I prefer all my information in one place and flowing smoothly - having to read about PCA and then flip forwards and backwards because the author has recycled information from elsewhere instead of printing it out twice got annoying. I bought the hard copy so can at least keep the pages open with paper weights - I'm not sure how well this works with the ebook.
Amazon Verified review Amazon
Get free access to Packt library with over 7500+ books and video courses for 7 days!
Start Free Trial

FAQs

How do I buy and download an eBook? Chevron down icon Chevron up icon

Where there is an eBook version of a title available, you can buy it from the book details for that title. Add either the standalone eBook or the eBook and print book bundle to your shopping cart. Your eBook will show in your cart as a product on its own. After completing checkout and payment in the normal way, you will receive your receipt on the screen containing a link to a personalised PDF download file. This link will remain active for 30 days. You can download backup copies of the file by logging in to your account at any time.

If you already have Adobe reader installed, then clicking on the link will download and open the PDF file directly. If you don't, then save the PDF file on your machine and download the Reader to view it.

Please Note: Packt eBooks are non-returnable and non-refundable.

Packt eBook and Licensing When you buy an eBook from Packt Publishing, completing your purchase means you accept the terms of our licence agreement. Please read the full text of the agreement. In it we have tried to balance the need for the ebook to be usable for you the reader with our needs to protect the rights of us as Publishers and of our authors. In summary, the agreement says:

  • You may make copies of your eBook for your own use onto any machine
  • You may not pass copies of the eBook on to anyone else
How can I make a purchase on your website? Chevron down icon Chevron up icon

If you want to purchase a video course, eBook or Bundle (Print+eBook) please follow below steps:

  1. Register on our website using your email address and the password.
  2. Search for the title by name or ISBN using the search option.
  3. Select the title you want to purchase.
  4. Choose the format you wish to purchase the title in; if you order the Print Book, you get a free eBook copy of the same title. 
  5. Proceed with the checkout process (payment to be made using Credit Card, Debit Cart, or PayPal)
Where can I access support around an eBook? Chevron down icon Chevron up icon
  • If you experience a problem with using or installing Adobe Reader, the contact Adobe directly.
  • To view the errata for the book, see www.packtpub.com/support and view the pages for the title you have.
  • To view your account details or to download a new copy of the book go to www.packtpub.com/account
  • To contact us directly if a problem is not resolved, use www.packtpub.com/contact-us
What eBook formats do Packt support? Chevron down icon Chevron up icon

Our eBooks are currently available in a variety of formats such as PDF and ePubs. In the future, this may well change with trends and development in technology, but please note that our PDFs are not Adobe eBook Reader format, which has greater restrictions on security.

You will need to use Adobe Reader v9 or later in order to read Packt's PDF eBooks.

What are the benefits of eBooks? Chevron down icon Chevron up icon
  • You can get the information you need immediately
  • You can easily take them with you on a laptop
  • You can download them an unlimited number of times
  • You can print them out
  • They are copy-paste enabled
  • They are searchable
  • There is no password protection
  • They are lower price than print
  • They save resources and space
What is an eBook? Chevron down icon Chevron up icon

Packt eBooks are a complete electronic version of the print edition, available in PDF and ePub formats. Every piece of content down to the page numbering is the same. Because we save the costs of printing and shipping the book to you, we are able to offer eBooks at a lower cost than print editions.

When you have purchased an eBook, simply login to your account and click on the link in Your Download Area. We recommend you saving the file to your hard drive before opening it.

For optimal viewing of our eBooks, we recommend you download and install the free Adobe Reader version 9.