Search icon CANCEL
Subscription
0
Cart icon
Your Cart (0 item)
Close icon
You have no products in your basket yet
Save more on your purchases! discount-offer-chevron-icon
Savings automatically calculated. No voucher code required.
Arrow left icon
All Products
Best Sellers
New Releases
Books
Videos
Audiobooks
Learning Hub
Newsletter Hub
Free Learning
Arrow right icon
timer SALE ENDS IN
0 Days
:
00 Hours
:
00 Minutes
:
00 Seconds
Arrow up icon
GO TO TOP
Python Data Analysis

You're reading from   Python Data Analysis Perform data collection, data processing, wrangling, visualization, and model building using Python

Arrow left icon
Product type Paperback
Published in Feb 2021
Publisher Packt
ISBN-13 9781789955248
Length 478 pages
Edition 3rd Edition
Languages
Arrow right icon
Authors (2):
Arrow left icon
 Navlani Navlani
Author Profile Icon Navlani
Navlani
Ivan Idris Ivan Idris
Author Profile Icon Ivan Idris
Ivan Idris
Arrow right icon
View More author details
Toc

Table of Contents (20) Chapters Close

Preface 1. Section 1: Foundation for Data Analysis
2. Getting Started with Python Libraries FREE CHAPTER 3. NumPy and pandas 4. Statistics 5. Linear Algebra 6. Section 2: Exploratory Data Analysis and Data Cleaning
7. Data Visualization 8. Retrieving, Processing, and Storing Data 9. Cleaning Messy Data 10. Signal Processing and Time Series 11. Section 3: Deep Dive into Machine Learning
12. Supervised Learning - Regression Analysis 13. Supervised Learning - Classification Techniques 14. Unsupervised Learning - PCA and Clustering 15. Section 4: NLP, Image Analytics, and Parallel Computing
16. Analyzing Textual Data 17. Analyzing Image Data 18. Parallel Computing Using Dask 19. Other Books You May Enjoy

The elbow method

The elbow method is a well-known method for finding out the best number of clusters. In this method, we focus on the percentage of variance for the different numbers of clusters. The core concept of this method is to select the number of clusters that appending another cluster should not cause a huge change in the variance. We can plot a graph for the sum of squares within a cluster using the number of clusters to find the optimal value. The sum of squares is also known as the Within-Cluster Sum of Squares (WCSS) or inertia:

Here is the cluster centroid and  is the data points in each cluster:

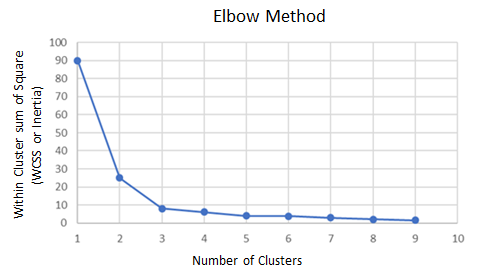
As you can see, at k = 3, the graph begins to flatten significantly, so we would choose 3 as the number of clusters.

Let's find the optimal number of clusters using the elbow method in Python:

# import pandas
import pandas as pd

# import matplotlib
import matplotlib.pyplot as plt

# import K-means
from sklearn.cluster import KMeans

# Create a DataFrame
data=pd.DataFrame...
lock icon The rest of the chapter is locked
Register for a free Packt account to unlock a world of extra content!
A free Packt account unlocks extra newsletters, articles, discounted offers, and much more. Start advancing your knowledge today.
Unlock this book and the full library FREE for 7 days
Get unlimited access to 7000+ expert-authored eBooks and videos courses covering every tech area you can think of
Renews at £13.99/month. Cancel anytime
Visually different images