Graphing with Tkinter
Tkinter is not a graphing tool. However, should you need to draw graphs with Tkinter, you can use the Canvas widget to draw graphs.
In this iteration, we will draw the following graphs:
- Pie chart (
8.02_pie_chart.py) - Bar graph (
8.03_bar_graph.py) - Scatter plot (
8.04_scatter_plot.py)
The three graphs show up as follows:
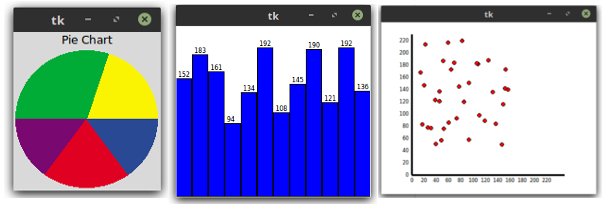
Let's look at the pie chart first. You can easily create a pie chart in Tkinter using the Canvas widget's create_arc method.
The create_arc method has the following signature:
item_id = canvas.create_arc(x1, y1, x2, y2, option, ...)
Point (x1, y1) is the top-left corner and point (x2, y2) is the bottom-right corner of the rectangle into which the arc fits. If the bounding rectangle is a square, it makes a circle. The method also takes two arguments, named start and extent, which we will use to create the pie chart.
The start option specifies the start angle for the arc, measured in degrees from the +x direction. When omitted, you get the complete ellipse. The extent...