Using the simple KPI extension
The Simple KPI extension is a great way to create a visualization of several KPIs, broken down by a specific dimension.
Getting ready
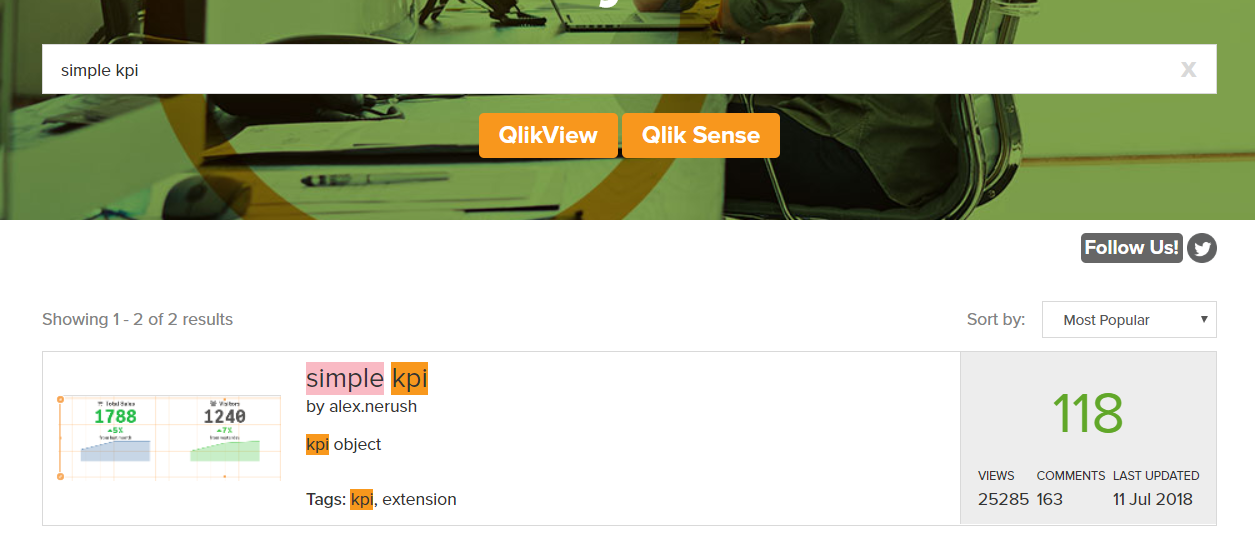
To start this recipe, first you need to download the Simple KPI extension from Qlik Branch, by searching for simple kpi in the search box:
After downloading the extension, install the extension in your Qlik Sense Desktop or server, following the previous recipe about importing extensions.
This recipe explains how to use the extension to show several examples of KPI-per-dimension data, without the need to create a separate object for each one.
How to do it…
- Open the
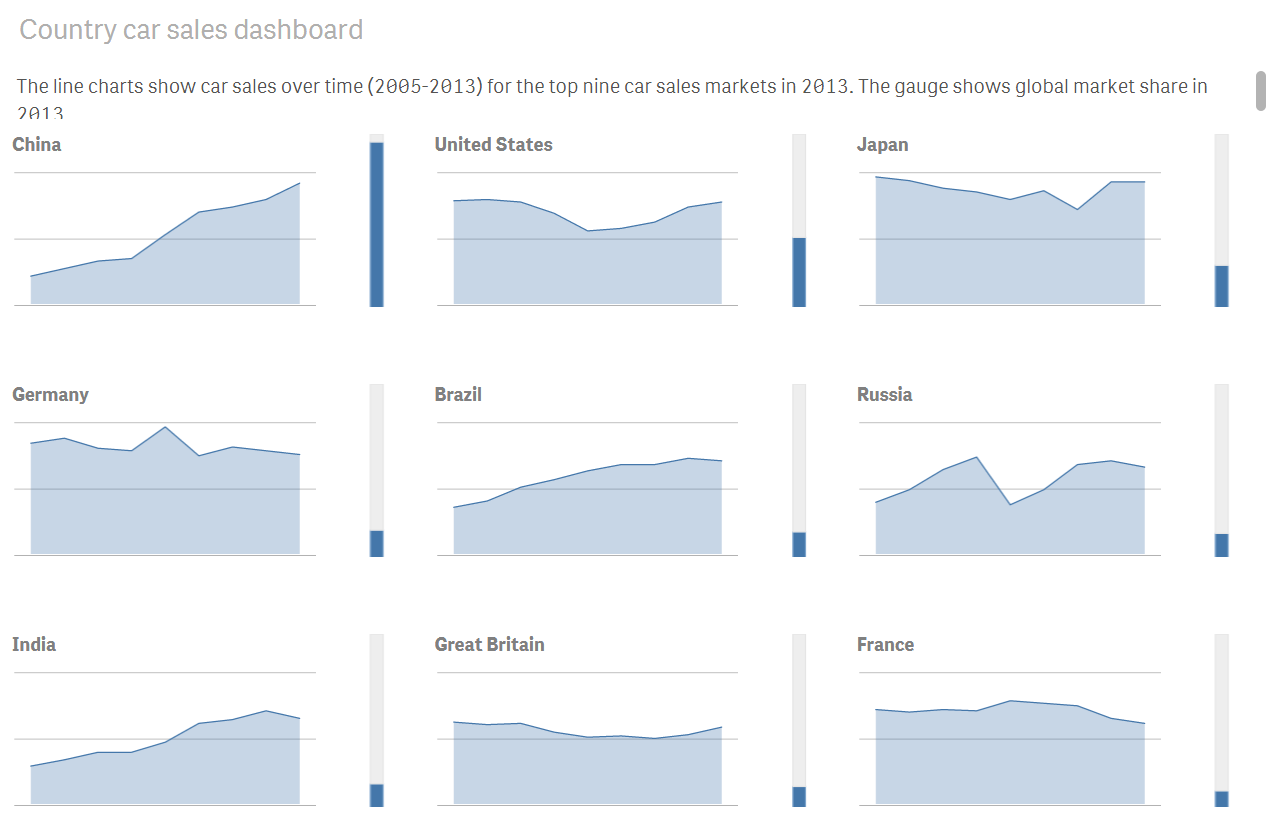
Automotive.qvfapp provided for Chapter 2, Visualizations. - Look in the
Country car sales dashboardsheet. - This sheet uses several objects, one for each of the nine top markets, to show market share as a gauge. With Simple KPI, we can a create something similar using one object:
- Duplicate the sheet and label it as
Simple KPI Dashboard. - Remove all charts (
Line chartandGauge...