Monitoring an Azure SQL Database using the Azure Portal
The Azure portal provides multiple monitoring options, which are available under the Overview | Monitoring | Support + Troubleshooting sections for an Azure SQL Database:
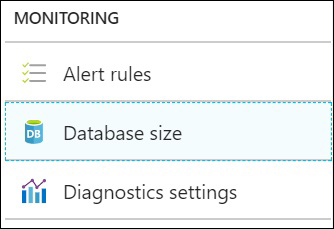
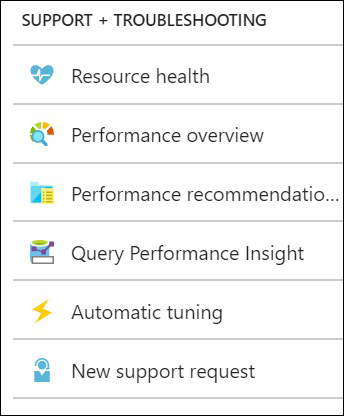
Let's talk about each of these options in detail.
Monitoring Database Metrics
Database metrics such as CPU percentage, DTU percentage, data I/O, and other metrics can be monitored through the overview section.
The overview section displays the DTU percentage from the past hour of an Azure SQL Database in the form of a line chart:
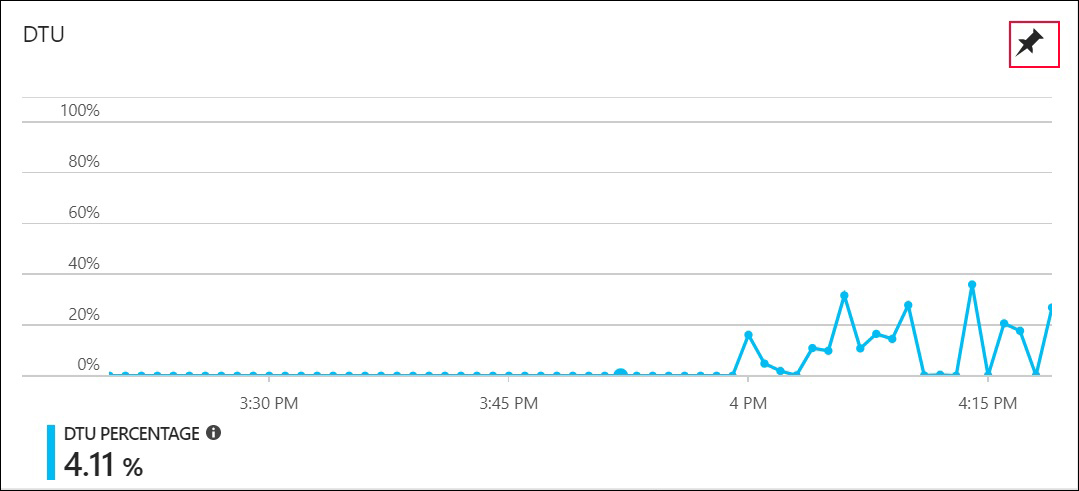
You can even pin the chart on your Azure portal dashboard by clicking on the pin icon in the upper-right corner of the chart.
This way, you can monitor the DTU percentage as and when required.
Note
In order to see the graph working, you will require some workload running. You can achieve this by executing the
Start-Workload.sql file placed in the
C:\code\Lesson09 folder.
Open a new PowerShell command and run the following command:
.\Start...