Monitoring Ceph with collectd
Previously in this chapter, we have covered what monitoring should be done around your entire Ceph infrastructure. Although the alert monitoring is out of scope of this book, we will now look at capturing the Ceph performance metrics with collectd, storing them in Graphite and then finally creating a dashboard with graphs using Grafana. These captured metrics can then be used in the following chapter to help tune your Ceph cluster.
We will build this monitoring infrastructure on one of our monitor nodes in our test cluster. In a production cluster, it is highly recommended that it gets its own dedicated server.
Graphite
Graphite is a time series database which excels in storing large amounts of metrics and has a mature query language, which can be used by applications to manipulate the data.
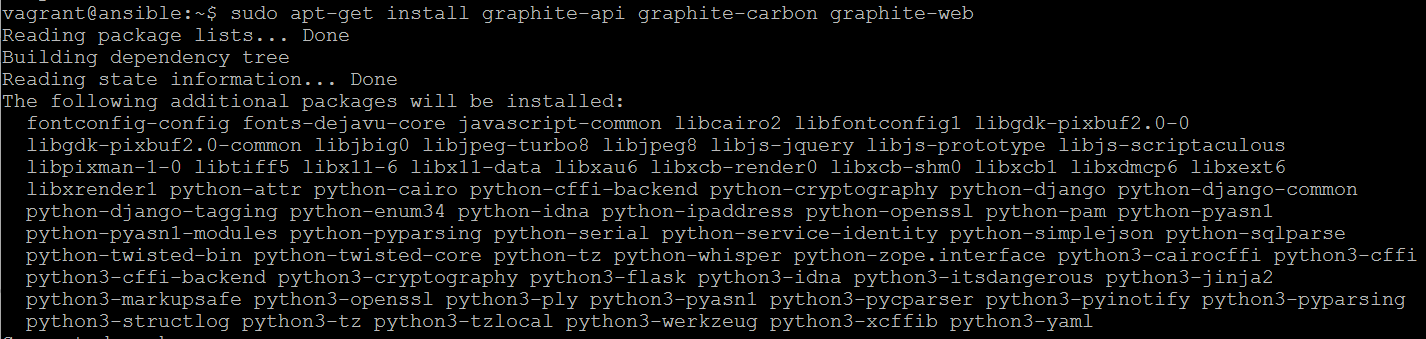
We first need to install the required graphite packages:
sudo apt-get install graphite-api graphite-carbon graphite-webThe preceding command gives the following output:
Edit...