Plotting
In this segment, we will see how to use Breeze to create a simple line plot from the Breeze DenseVector.
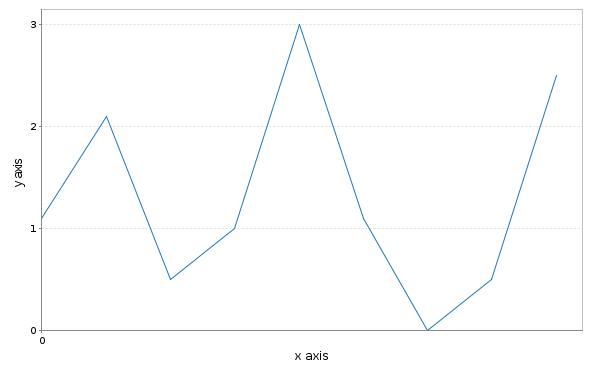
Breeze uses most of the functionality of Scala's plotting facilities, although the API is different. In the following example, we create two vectors x1 and y with some values, and plot a line and save it to a PNG file:
package linalg.plot
import breeze.linalg._
import breeze.plot._

object BreezePlotSampleOne {
  def main(args: Array[String]): Unit = {

    val f = Figure()
    val p = f.subplot(0)
    val x = DenseVector(0.0,0.1,0.2,0.3,0.4,0.5,0.6,0.7,0.8)
    val y = DenseVector(1.1, 2.1, 0.5, 1.0,3.0, 1.1, 0.0, 0.5,2.5)
    p += plot(x,  y)
    p.xlabel = "x axis"
    p.ylabel = "y axis"
    f.saveas("lines-graph.png")
  }
 }
The preceding code generates the following Line Plot:
Breeze also supports histogram. This is drawn for various sample sizes 100,000, and 100,0000 normally distributed random numbers into 100 buckets.
package linalg.plot
import breeze.linalg...