
Visualizing graphs
In this recipe, we'll build a generic utility function for taking a graph (in other words a network of nodes and links), and representing it on an HTML canvas so that it can be viewed in a web browser. We'll create a Python application, render-graph.py, that will take as input a JSON representation of a graph and output a completed HTML page that renders the graph and allows user manipulation.
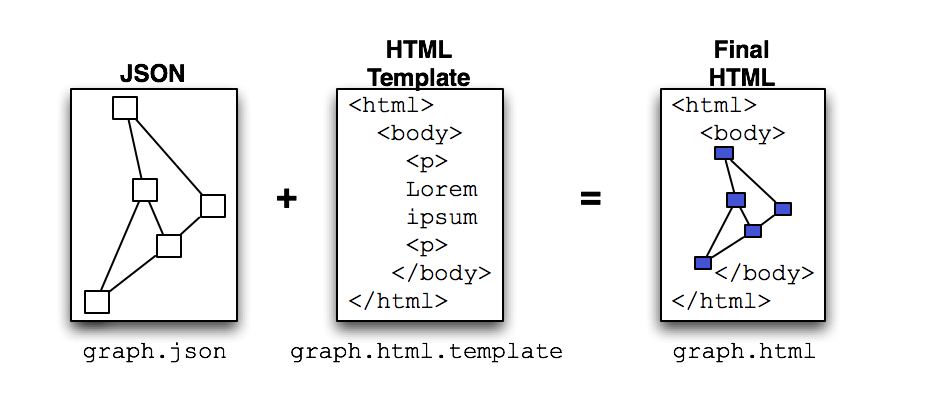
Combining graph data with HTML template to produce interactive map
Getting ready
In order to complete this recipe, you don't need access to a JUNOS device—yet! You need a Python 2.7 development environment and a web browser. We'll make use of the excellent VivaGraph graph visualization library, written by Andrei Kashcha, and simply write the HTML and JavaScript that call the fundamental functions in that library to do the work for us.
Graph principles
Unsurprisingly, graph theory underpins a lot of the work that we do in networking, so it can be helpful to have a basic understanding of...