Example 1 – k-means on simple 2D data
We've got our implementation of the k-means algorithm written and coded, so now it's time to see how it works. In our first example, we'll run our algorithm against a simple dataset of two-dimensional data. The data itself will be contrived so that the algorithm can easily find three distinct clusters.
First, modify the data.js file to add the following data, anywhere preceding the export default line:
const example_2d3k = [
    [1, 2], [2, 3], [2, 5], [1, 6], [4, 6],
    [3, 5], [2, 4], [4, 3], [5, 2], [6, 9],
    [4, 4], [3, 3], [8, 6], [7, 5], [9, 6],
    [9, 7], [8, 8], [7, 9], [11, 3], [11, 2],
    [9, 9], [7, 8], [6, 8], [12, 2], [14, 3],
    [15, 1], [15, 4], [14, 2], [13, 1], [16, 4]
];
Then, update the final export line to look like this:
export default {
example_randomCentroids,
example_2d3k
};
If we were to graph the preceding data points, we would see the following:
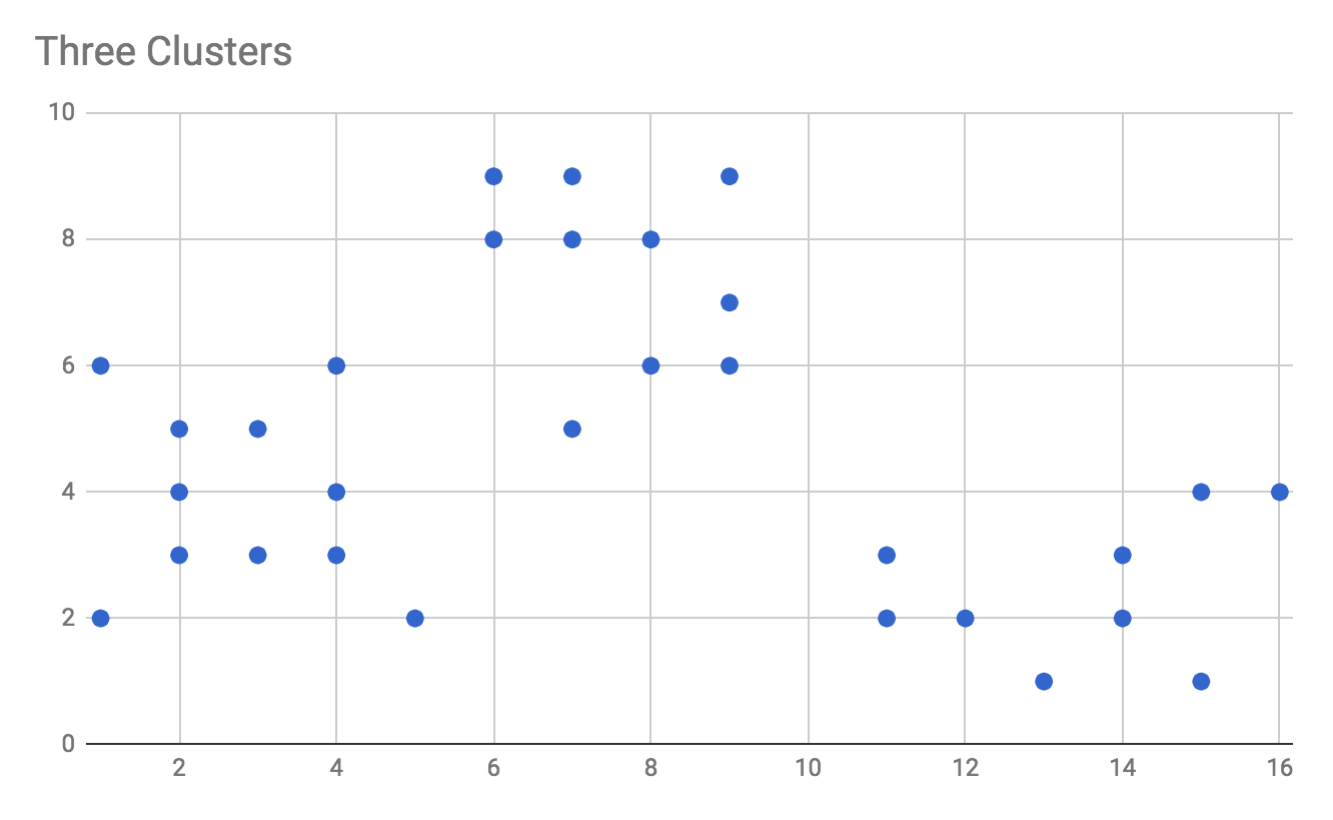
Visually, we can see that there are three neatly clustered groups of data points...